Apr 07 2009
The End Of The Global Warming Myth
The high Priests of the Church of Al Gore/IPCC have been predicting pending global doom for coming on 20 years now. There so called scientific models predicted if nothing was done about CO2 levels over that period the Earth would warm up by 0.6° C since 1988-90 (within the range of 0.4°-1.0° C). It never happened. The actual data shows how pathetically wrong these Chicken Littles were:
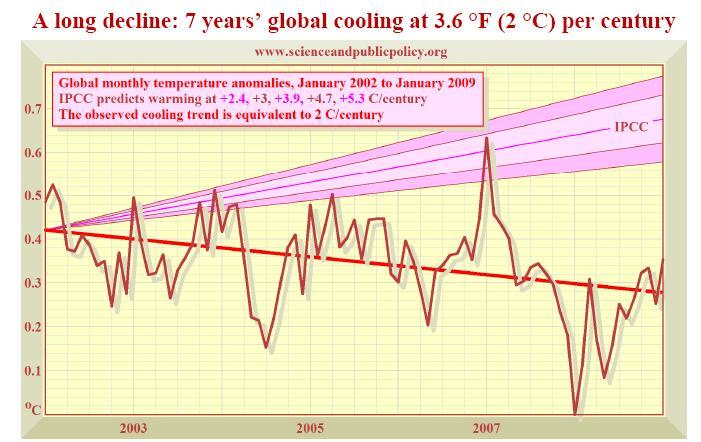
We’ve had 20 years to validate the mythological theories, and the data is in. The IPPC theory is on the top arcing out of reality, the actual measurements are on the bottom. Here is another chart proving the obvious:

Each figure is a link to the original sources. Â The myth of Man Made Global Warming due to CO2 is now busted! Reality meets theory, and the man-made models lost to reality.
You can read about all the other hard evidence to this now established fact in my earlier posts on the matter.


I find it amazing that you posted this on the same day that this was published:
“The Arctic sea ice cover continues to shrink and become thinner, according to satellite measurements and other data released yesterday, providing further evidence that the region is warming more rapidly than scientists had expected. […]
The new evidence — including satellite data showing that the average multiyear wintertime sea ice cover in the Arctic in 2005 and 2006 was nine feet thick, a significant decline from the 1980s — contradicts data cited in widely circulated reports by Washington Post columnist George F. Will that sea ice in the Arctic has not significantly declined since 1979.
Scientists have begun debating how soon the Arctic will lose its summer ice altogether, with some saying it could happen as early as 2015. White House science adviser John P. Holdren told the crowd at the State Department that the total disappearance of sea ice in the Arctic “may be far, far closer” than scientists thought just a few years ago.”
And yes, I know you’ll ignore this – but hey, it’s a slow day.
Re: sea ice
Please read this…
http://wattsupwiththat.com/2009/04/07/nsidc-raises-the-bar/#more-6858
More garbage from the Washington Post, but hey what do you expect from a second rate newspaper…
Also, check out the southern hemisphere ice…look at that trend …hmmm….
http://nsidc.org/data/seaice_index/images/s_plot_hires.png
[…] of anthropogenic global warming predicted. In point of inconvenient fact, they falsify the theorem: The End Of The Global Warming Myth By A. J. Strata The […]
Guy,
All you are referencing are more bogus models when referring to iceless summers in the North. You’d think you would learn to detect charlatans after a few times being had. Fool you once, shame on them, fool you twice – shame on you!
The sea ice is thinner, but only in the North, there have been record sea ice extent in the South, so it cannot be atmospheric CO2 (which covers the planet).
As I noted in a previous posts there was a massive volcanic explosion under the northern ice cap. Larger than any ever recorded (and that includes some large ones in human’s history).
For all you know the ice is melting because of the hot water coming up from the chain of volcanos.
And it is also thinner as it replenishes from the warm years. It is getter thicker and larger every year now.
Seems you are easily fooled by people with incomplete data. How does it feel to be so damn gullible?
You keep playing with your models and I will let reality dictate the answer.
Guy,
Ice in 2007 was blown out into the Atlantic due to anomalous wind currents, not due to “warming”. There was more ice in 2008 than in 2007. Ice currently in 2009 is, on average, about a half-meter thicker than it was at this time in 2008 … so the ice is continuing to recover from that anomaly.
Here is a running graph of Arctic sea ice. 2008 is looking pretty good. Probably close to 2004. The late season melt will be greater than 2004 because of the newer ice, but it will be less than 2008 because there is more 2yo ice this year than last year.
The ice is recovering just fine.
Southern Hemisphere ice has been at all time records the past few years.
I have a question about Guy’s comment and the Posts article. When they state that the arctic ice is melting are they accurate to say that it is proof of global warming without providing some sort of collaborating evidence to show that there is a connection between the two? If I have a theory and then I take as anything that fits that theory as evidence for my theory am I proving anything?
Let’s say I have a theory that higher levels of meteor dust is causing the earth to warm. Then I find that my back yard pool is warmer then it was last year can I conclude my theory of increased meteor dust must be right without showing their is a relation between the two.
This is what to me – a non-scientific thinker – seems to be a problem with the global warm argument. They have a theory that the earth is warming because of increased levels of CO2. Then every thing that makes it appear the earth is warming is evidence that the earth is warming because of increased levels of CO2. But they do not demonstrate how the two are related, they just assume they are because it further proves their theory.
Any of you more scientific thinkers care to gives this some thought and correct me if I am wrong?
Alert201, you’ve hit the proverbial nail on the head. What you have described, and it is very common (to the point of being universal) among the proponents of the AGW theory. (anthropegnic global warming, now misleading called “climate change.”)
What you describe is known as the “Post hoc, ergo propter hoc” logical fallacy. (also known as “correlation, not causation”.) The Scientific Method of hypothesis, skepticism, analysis, and proof (or rejection) is designed to prevent this kind of error. Of course, whenever you hear the word “consensus” you know that the Scientific Method has been abandoned – and you also know that anyone who uses such a word either has no understanding of or no respect for the Scientific Method of analysis.
discussion at
http://en.wikipedia.org/wiki/Post_hoc_ergo_propter_hoc
Alert1201,
Welcome to the world of liberal and “progressive” reasoning. If A happens. And B happens. Then A caused B—or visa versa if that fits what you want. That’s “science” and “fact” to them.
Thanks WWS and Dc! I knew there had to be some strange Latin name for it. Next time I’m arguing with a liberal about AGW and he brings up sea ice I just say “That is a Post hoc, ergo propter hoc argument” and see what kind of dear-in-the-headlights reaction I’ll get.
AJ, while the three-year graph trends downward, the 20-year graph trends upward. Please tell me you can see that.
2009 ice hasn’t really even begun to drop off from its peak yet. Looks to me like it is getting closer to ‘average’ than to what it was in 2007.
Latest North Pole temperatures are here and at -33.5C I would expect the ice to be getting thicker at the pole. I don’t think they have made an ice yet that melts at -33.5C (-28.3F)
Giantslor,
Of course I can. But the CO2 levels have not dropped and have continued upwards.
Which means CO2 cannot be the driving force. You can see that – right?
AJ,
No, I don’t follow your logic at all. Why does that mean CO2 cannot be the driving force? Now, if CO2 levels dropped while temperatures continued to increase, then I’d see your logic that CO2 could not be the driving force.
Giantslor,
Well, you have to have known that CO2 has been rising while temperatures have been dropping, as has been shown on other posts on this site.
I don’t copy each diagram each time. People who want to debate this need to have done their homeworlk.