Search Results for "1930"

Nov 29 2009

CRU Raw Temp Data Shows No Significant Warming Over Most Of The World

Bottom Line – Using two back-of-the-envelope tests for significance against the CRU global temperature data I have discovered:

  • 75% of the globe has not seen significant peak warming or cooling changes between the period prior to 1960 and the 2000’s (significance being a rise above 0.5°C threshold, which is well within the CRU’s own stated measurement uncertainties of +/- 1°C or greater for any one year.
  • Assuming a peak to peak change (pre-1960 vs 2000’s) should represent a change greater than 20% of the measured temperature range (i.e., if the measured temp range is 10° then a peak-to-peak change of greater than 2° would be considered ‘significant’) 87% the Earth has not experienced significant temperature changes between the pre-1960 period and the 2000’s.

So how did I come to this conclusion? If you have the time you can find out by reading below the fold.

Continue Reading »

25 responses so far

Nov 27 2009

Finally, The Real Scientific Process Begins On AGW – In New Zealand

Smoking Gun Update Below

The real scientific process is to present a hypotheses (along with experimental data and algorithms and codes) to the community (doesn’t have to be hand picked by a science journal) for scrutiny and debate. The community will give the hypothesis a determination if it is feasible (but not fact, that takes another step). Missing from the Global Warming discussions has been the real scientific process.

In its place we have seen a corrupted process where those promoting the hypothesis have rigged the review with allies and squelched dissenting views with persecution and threat.

But now, with the CRU data exposed to the world we can get back to a real process, and it seems it will begin in New Zealand (sorry, can’t copy the text). The Parliament there is not standing for the one station excuse to let stand the questionable conclusions of massive global warming in New Zealand, when the raw data does not show any such phenomena.

My guess is this will be the tipping point. I feel comfortable that the assumption used to massage the raw data into a picture of runaway warming cannot stand up to scrutiny. As I have stated many times, each step in the massage process increases the error in the result. When you use trend lines and averages you lose accuracy, the result contains large increases in uncertainty.

I expect to see this review process identify the unproven assumptions, and establish uncertainty levels in the conclusions which show that there is as likely a cooling as warming, given all the error prone steps required to turn a flat temperature profile into runaway global warming.

The math is fairly brutal here, which is why we never see detailed and defendable error budgets.

Smoking Gun Update: And all those clinging to the claims the New Zealand alarmists will be able to prove their adjustments are reasonable – forget it. The NIWA (creators of Kiwi AGW) came out and drove their own nail into their argument, by showing how they adjusted the example site. Before:

After:

See the obvious mistake here? The pre 1930 record (which will be much more sparse than the modern record) was dropped a full degree. Thus we get that push downward in the early part of the record. The dropping of the modern site does very little since it overlapped the other site and would have been ‘averaged’ in with it.

This is just wrong. Mathematically wrong. Instead of thinking temperature just view these as average heights. The average height of the first series is much different from the second. The first series is reality as measured for years in many places. The second series is statistical fiction. And I bet you this kind of sloppy reasoning permeates the record. For a real laugh go read their lame excuses for smearing over reality like this.

2 responses so far

Nov 25 2009

The AGW Cover Up Is In The Code – Smoking Gun Update!

Update: Another SW engineer concludes the CRU code shows clear data manipulating to cool off the 1940’s warm period and warm up the currently cooling period. – end update

I can now understand why Jones and Co. were so resistant to providing code and data – it would not take long for the army of skilled skeptics with backgrounds in science, engineering, math and programming to unravel the truth. And now that the dirty laundry is in the hands of 100’s of sharp minds on the internet, were are discovering the depth and breadth of the AGW con.

I have been off work for a couple of days now so as to wade through all the details, but in this race there are too many good people doing the good work, so I will link to those who are credible in their analysis.

I have seen inklings of how bad the CRU code is and how it produces just garbage. It defies the garbage in-garbage out paradigm and moves to truth in-garbage out. I get the feeling you could slam this SW with random numbers and a hockey stick would come out the back end. There is no diurnal corrections for temperature readings, there are all sorts of corrupted, duplicated and stale data, there are filters to keep data that tells the wrong story out, and there are create_fiction sub routines which create raw measurements out of thin air when needed. There are modules which cannot be run for the full temp record because of special code used to ‘hide the decline’.

For details on some of the smoking guns found in the CRU code check this out:

I ran across warns that the particular module “Uses ‘corrected’ MXD – but shouldn’t usually plot past 1960 because these will be artificially adjusted to look closer to the real temperatures.”

What exactly is meant by “corrected” MXD, you ask? Outstanding question — and the answer appears amorphous from program to program. Indeed, while some employ one or two of the aforementioned “corrections,” others throw everything but the kitchen sink at the raw data prior to output.

For instance, in subfolder “osborn-tree6\mann\oldprog” there’s a program (Calibrate_mxd.pro) that calibrates the MXD data against available local instrumental summer (growing season) temperatures between 1911-1990, then merges that data into a new file. That file is then digested and further modified by another program (Pl_calibmxd1.pro) which creates calibration statistics for the MXD against the stored temperature and “estimates” (infills) figures where such temperature readings were not available. The file created by that program is modified once again by Pl_Decline.pro, which “corrects it” – as described by the author — by “identifying and “artificially” removing “the decline.”

But oddly enough – the series doesn’t begin its “decline adjustment” in 1960 — the supposed year of the enigmatic “divergence.” In fact, all data between 1930 and 1994 are subject to “correction.”

(H/T Newsbusters)

“Correction”? Adds a whole new meaning to the phrase “Politically Correct”. I am now very positive the cover up will be proven by the code. The very code Phil Jones and others were willing to destroy before making public.

And one can truly understand those feelings.

After all, who wants to go down in history as the folks who went to jail for the scientific scandal of the century? Sort of reminds me of Galileo’s challenges when he defied the High Priests of his time with real science and showed the Earth was not the center of the Universe. Seems CRU and IPCC are not the center of all intelligence on Earth either.

Update: As I noted in my earlier post the cover up to make AGW real meant CRU had to reduce the ‘1940’s blip” which is seen world wide in the CRU temp data. This period is as warm or warmer than today. One way to take raw temp data (as shown in the previous post) and squelch the temperatures is to run tree ring proxies over it (Keith Briffa’s apparent job). It seems tree rings alone were not enough, as Marc Shepard at American Thinker (linked above) discovered:

In 2 other programs, briffa_Sep98_d.pro and briffa_Sep98_e.pro, the “correction” is bolder by far. The programmer (Keith Briffa?) entitled the “adjustment” routine “Apply a VERY ARTIFICAL correction for decline!!” And he/she wasn’t kidding. Now, IDL is not a native language of mine, but its syntax is similar enough to others I’m familiar with, so please bear with me while I get a tad techie on you.

Here’s the “fudge factor” (notice the brash SOB actually called it that in his REM statement):
yrloc=[1400,findgen(19)*5.+1904]

valadj=[0.,0.,0.,0.,0.,-0.1,-0.25,-0.3,0.,-0.1,0.3,0.8,1.2,1.7,2.5,2.6,2.6,2.6,2.6,2.6]*0.75 ; fudge factor

These 2 lines of code establish a 20 element array (yrloc) comprised of the year 1400 (base year but not sure why needed here) and 19 years between 1904 and 1994 in half-decade increments. Then the corresponding “fudge factor” (from the valadj matrix) is applied to each interval. As you can see, not only are temperatures biased to the upside later in the century (though certainly prior to 1960) but a few mid-century intervals are being biased slightly lower. That, coupled with the post-1930 restatement we encountered earlier, would imply that in addition to an embarrassing false decline experienced with their MXD after 1960 (or earlier), CRU’s “divergence problem” also includes a minor false incline after 1930.

So we have  the smoking gun. Here we have the hardcoded values showing how you can turn this (green box highlights the 1940’s blip):

Into this, where there is only a shadow of the 1940’s blip left:

The data is hard coded right there! The early negative numbers push the curve down in the 1930-40 period, and the later positive numbers shift the current day temps up high, making it LOOK like today is significantly warmer than 6 years ago (which the raw CRU data does not show!).

9 responses so far

Sep 30 2009

Update II On The Rigged Global Warming Data

It looks likes the straw that might destroy the global warming alarmists’ charade will be the discovery that man-made global warming is really man-made. It is either deception or delusion (or both), but it is NOT reality. It was created by scientists using cherry picked data.

Steve McIntyre at Climate Audit did the work to show that it required a unique and non-random selection of data from Russian tree ring data sets (12 out of 252 sets) to create the impression there has been significant global warming over the last 50-100 years. But even more importantly, he showed that when the entire available tree ring set of data from that area is used there is NO record of global warming. None. He basically determined that the whole global warming fear mongering is based on faulty data.

The following graph shows the results in shocking clarity. The red line showing a huge rise in global temperature is that special 12 sets of data. The black line below is all the regional data – and it shows no rise in global temperature.

rcs_merged_recent1

In fact, it shows that the peak global temps happened in the 1930’s and this coincides with temperature record data showing the 1930’s with the most new high records of any decade – including the 1990’s and 2000’s. Clearly if the red line was right, we would be breaking record every decade since. We have not.

This is staggering news. Credibility is required to scream the end of the world is coming – and then add with a straight face we all must hand over trillions of dollars in CO2 credits right now, destroy our economic growth and toss tens of millions of people out of their jobs to avert disaster. Without credibility anyone spouting this nonsense would be locked up in an insane asylum so they cannot be a harm to themselves or others.

Now the doom and gloom scenarios from  Al Gore and his IPCC cohorts has been unearthed as mundane science fiction (just like his suite of of lame movies).

It has been only days since the news began to rocket around the blogosphere, but the initial noises point to a cultural tsunami that could put liberal Chicken LIttles into the history books of stunning human failures (along with the Ford Edsall, using leeches to bleed the ill, witch doctors and witch burnings).

First, I am 100% behind this call for the scientists behind this bogus data to come forward and explain themselves.

Mr McIntyre’s analysis of the data – which he had been asking for since 2003 – suggests that scientists at the Climate Research Unit of the Hadley Centre associated with the UK Met. Office  have been using only a small subset of the available data to make their claims that recent years have been the hottest of the last millennium.   When the entire data set is used, Mr McIntyre claims that the hockey stick shape disappears completely.

It is indeed time leading scientists at the Climate Research Centre associated with the UK Met. Office explain how Mr McIntyre is in error or resign.

If they were wrong and McIntyre is right – they should resign. If they cherry picked the data and produced false results – they should go to jail. This could be the biggest Hoax & Con in history. In fact, I think the Cap & Trade tax should be call the “Hoax & Con Tax” – at least it would be more accurate. And maybe liberals should run on Hope and Con, or Hoax and Change?

Anyway, the news of this scientific disaster has not gone unnoticed in the UK:

At least eight papers purporting to reconstruct the historical temperature record times may need to be revisited, with significant implications for contemporary climate studies, the basis of the IPCC’s assessments.

At issue is the use of tree rings as a temperature proxy, or dendrochronology. Using statistical techniques, researchers take the ring data to create a “reconstruction” of historical temperature anomalies. But trees are a highly controversial indicator of temperature, since the rings principally record Co2, and also record humidity, rainfall, nutrient intake and other local factors.

Picking a temperature signal out of all this noise is problematic, and a dendrochronology can differ significantly from instrumented data. In dendro jargon, this disparity is called “divergence”. The process of creating a raw data set also involves a selective use of samples – a choice open to a scientist’s biases.

Yet none of this has stopped paleoclimataologists from making bold claims using tree ring data.

Scientists have ensured much of the measurement data used in the reconstructions remains a secret – failing to fulfill procedures to archive the raw data. Without the raw data, other scientists could not reproduce the results. The most prestigious peer reviewed journals, including Nature and Science, were reluctant to demand the data from contributors. Until now, that is.

The scandal has serious implications for public trust in science. The IPCC’s mission is to reflect the science, not create it.

The fact is the science of global warming is the mathematics of a con. I will say it again – without these select few data sets there is no evidence of any global warming in the last 100 years. When ALL the available data these scientists had in their possession was processed, there was no sign of global warming. These people hid data for years they had in their possession which also  disproved their claims. Dishonest does not even begin to describe this.

Worse, they connived tax payers out of 100’s of millions of dollars for their research and causes. Bernie Maddoff has nothing on these people.

Keep spreading the word. Keep the spotlight on these people. Truth will Out!

My previous posts on this astounding news:

Paul Krugman Tries To Play Scientist, As Real Scientist Uncover Serious Flaw In Global Warming Data

Update To Rigged Global Warming Data

Update: More on the event here, in layman’s terms.

4 responses so far

Sep 17 2009

President & DC Liberals Laying The Ground For Another Great Depression

Published by under All General Discussions

There are “troubling similarities” between the US President’s actions since taking office and those which in the 1930s sent the US and much of the world spiralling into the worst economic collapse in recorded history, says the new pamphlet, published by the Institute of Economic Affairs.I have been loathe to jump on the “economy is headed for a wreck” bandwagon for a couple of reasons. But now I have to admit the possibility the misguided and ignorant liberal policies in play could doom this nation to a long economic grind. Of course, assuming the current and proposed screw ups well up being misguided and ignorant is being optimistic on the drivers here. There could be much more sinister plans at work here – assuming people cling to the government for help during bad economic times, as opposed to throwing the screw ups out of power and bringing in fresh, young blood.

The first big siren call that the President and Congress were throwing salt on the economic wounds came from overseas actually, the UK to be exact:

Barack Obama is committing the same mistakes made by policymakers during the Great Depression, according to a new study endorsed by Nobel laureate James Buchanan.

There are “troubling similarities” between the US President’s actions since taking office and those which in the 1930s sent the US and much of the world spiralling into the worst economic collapse in recorded history, says the new pamphlet, published by the Institute of Economic Affairs.

In particular, the authors, economists Charles Rowley of George Mason University and Nathanael Smith of the Locke Institute, claim that the White House’s plans to pour hundreds of billions of dollars of cash into the economy will undermine it in the long run. They say that by employing deficit spending and increased state intervention President Obama will ultimately hamper the long-term growth potential of the US economy and may risk delaying full economic recovery by several years.

OK, that was part theory. The fact is there has been evidence for a while the liberal policies coming out of DC were going to really hurt the economy, and therefore every person in the country except the uber rich. The stimulus package is a prime example of all talk, no results. It relied on the bloated and sluggish government bureaucracy to start up make work projects. They should be starting up in mass in by next year. The government processes are that slow. Instead of using tax cuts to prime the economic pump, they pulled money out of the economy and sent it towards pork projects of preferred constituents. Seems only the good shall be rescued.

But it is getting worse – even as America has yet to fathom that possibility. The Cap & Trade proposals to pretend to shrink CO2 will cost each family a significant chunk of their money (some claim $1800 a year – I think it will be much higher). Nothing new will happen, just life will be much more expensive. Even though we now have evidence from a new space mission, designed to show exactly were the green house gas producers are on Earth, that America is not a massive green house gas producer after all! Nothing we do here will offset the large producers of green house gas in Europe, Asian, the Mideast and Africa. Nothing. We will lose jobs and disposable income and Al Gore will become a $gazillionaire. But that is all this crazy liberal scheme will produce.

Then there is the planned destruction of our health care system with the idea of forcing us into government rationed health care, where DC decides who should be treated and who should not. Think that is going to be a positive force on our economy as the government rips out 1/6th of it? The irony is all those doe-eyed youngsters chanting ‘hope & change’ will be the ones footing the biggest part of the bill after seniors. What a just reward for voting on an image instead of the issues and the liberals whacky proposals.

But it gets even worse than this. The economic bubble burst over the sub prime mortgages liberals in Congress pushed through to help the poor (read: unable to afford) buy houses. What ensued was a predatory bonanza where mortgages were let out to millions of people without checks or backing, and then sold to the taxpayers. Who just bailed out all the crooks who lined their pockets and left their mess to collapse the confidence of the markets. Is this liberal congress going to make sure this does not happen again?

Hell no! They are going for more of the same! (H/T Reader Frogg1)

A number of experts believe that aggressive enforcement of the 1970s-era Community Reinvestment Act contributed to the mortgage meltdown, and thus to the greater financial crisis, by requiring financial institutions to lend to unqualified borrowers. Now, the Democratic majority in the House of Representatives is responding to that situation by proposing to expand the scope and power of the Community Reinvestment Act.

This morning House Financial Services Committee chairman Rep. Barney Frank held a hearing on H.R. 1479, the “Community Reinvestment Modernization Act of 2009.” The bill’s purpose is “to close the wealth gap in the United States” by increasing “home ownership and small business ownership for low- and moderate-income borrowers and persons of color.” It would extend CRA’s strict lending requirements to non-bank institutions like credit unions, insurance companies, and mortgage lenders. It would also make CRA more explicitly race-based by requiring CRA standards to be applied to minorities, regardless of income, going beyond earlier requirements that applied solely to low- and moderate-income areas.

Barney Frank is insane – that is all I can figure. He is also a socialist, because all he thinks about is playing Robin Hood with other people’s money (the government was the problem in the popular story, but that doesn’t stop Mad Money Frank). He makes drunken sailors look spend thrifty, and sober to boot!

But we are not done yet with the mounting evidence Team Obama and the DC liberals are going to send this economy back down into the tank again. Michael Barone notes other plans in action and in the works, identical to missteps made in the 1930’s:

Then there’s trade protectionism. A week ago Friday, late at night, the Obama administration slapped import tariffs on Chinese tires. The Chinese retaliated by imposing tariffs on auto parts and chickens — take that, United Auto Workers and Tyson Foods! Upshot: American consumers will pay more for tires, and auto-parts and chicken-processing jobs will be at risk.

And more of that may be in store. “The smell of trade war is suddenly in the air,” writes The Wall Street Journal, and Global Trade Alert reports that 130 protectionist measures are ready to be implemented by countries around the world. Are we seeing a repeat of the job-destroying protectionism that followed the Smoot-Hawley tariff of 1930? It’s starting to look like it.

Trade wars lead to real wars folks. One way to break and peace is to threaten livelihoods, careers and businesses. That is not all Michael noted, there are the pending tax increases coming next year as the wise Bush tax cuts (which pulled us out of the 9-11 tail spin and through two wars) are set to expire.

All in all, the evidence is building up that the liberals in DC are (a) either the most incompetent group of people this nation has ever seen and their idiotic fantasy policies are going to do needless damage to our economy and ignite international trade wars (and maybe a real one) OR these people are very clever, very smart and are taking the steps anyone would take to create crisis economically and internationally, in the hopes they can exploit those crises to acquire more power. That second idea is in itself dumb as a rock, since this nation is made up of millions of independently minded, capable people who are more than able to throw the bums out of office.

I do not have a clue which is right, it may be a combination, it could be neither. But I will note this, both scenarios assume the American people cling to government to protect them from reality. One is a benign, ignorance driven assumption, the second would be conniving and traitorous. Either way, they are both wrong assumptions, so events will not play out as expected. Reality always brings surprise endings.

12 responses so far

Aug 02 2009

Nation’s Unemployment Is Liberals’ Waterloo

Published by under Measuring The Recovery

It was a giddy time in DC for liberals back in January of this year. They had wiped the GOP off the political map and had control of both ends of Pennsylvania Avenue. 15 years of pent up frustration, built up since the GOP takeover of Congress in 1994, had finally been released. The old guard liberals, who would finally take the gavels and pound their young inexperienced president into line, were going to change America! They were going to remake it to conform with the liberal myths and fantasies these 60’s rejects spent a lifetime naively believing in.

Here we sit 7 months later, with what is clearly a “teachable moment”. The first remake of the world turned out to be the now failed stimulus bill. It was different from most previous successful economic ‘stimulus’ packages in that it relied heavily on government spending to fix the economy – not economic incentives. Prior economic downturns were met with tax cuts and investment incentives to spur growth, innovation and investment. 

But this time around the liberals wanted to prove once and for all that government was the superior entity, the governing light, the leader – not the tail wagging the dog. And so there were a few tax cuts and incentive based elements to get the left -of-center, fresh faced congress critters on board. But it was window dressing around the core policies.

In fact, these are the same insignificant elements the DC liberals are now trying to trot out as helping keep things from getting worse. These fools now claim the measly tax cuts and block grants to states  stopped things from being worse! But the truth is, if they have loaded the original bill up with sufficient quantities of these incentives, as has been done many times before going back to President Kennedy in the early 1960’s, then the recession would have been MILDER. We would not be in this deep.

The waste, fraud and abuse of the liberals’ risky economic scheme was in relying on massive spending programs, which dwarfed the tax cut element, and still have yet to start spending money. For you see, the Federal Government is a sluggish Leviathan which takes years to plan spending money, award the work and monitor the effort which ALWAYS comes in late, substandard and over budget. The only reason we use the government to perform work is it needs to be done outside the market place – like national defense and the scientific  exploration of space and the oceans. These may be wasteful and cumbersome endeavors, but they pay off in the end.

But this formula doesn’t work with wasted and late stimulus spending. That does not pay off. As I have noted many times, the job spending component of the stimulus bill is stuck in the federal bureaucracy. As of 7/10/09 we are still waiting for 99% of the money to come out of the bowels of the federal bureaucracy (I will publish updated numbers on 8/7/09 when the July unemployment numbers come out).

In the first graph there are 4 sets of columns showing: (from left to right) (1) the amount budgeted for stimulus programs in that organization, (2) the amount allocated to specific programs, (3) the amount actually spent creating jobs (the bottom line) and (4) the amount unspent from the total budget. (click image to enlarge)

The second chart translates the dollar amounts for the last three sets of columns into percentages of the budgeted amounts. (click image to enlarge)

At least now the country has learned a harsh truth – don’t believe politicians promising immediate stimulus by way of government programs. Even the liberals in DC have had to change their tune, and extend the timeline out to years, not weeks. Myth debunked.

A few weeks ago the NY Times – in what must have been a rare fit of professional journalism for them – noted that the unemployment situation was much worse than it seems on the surface. I cannot copy the graphic here, so please visit it and spend some time digesting it. But let me relate some of the startling numbers:

Under a broader definition of joblessness, some states have rates higher than 20 percent. This rate includes part-time workers who want to work full time, as well some people who want to work but have not looked for a job in the last four weeks.

  • California: unemployment rate is 11%, the broader underemployment rate is 20%
  • Michigan: unemployment rate is 13%, the broader underemployment rate is 22%
  • Florida: unemployment rate is 9%, the broader underemployment rate is 17%

For those keeping track this data is over a month old and based on the May unemployment numbers, not the much worse June numbers. Michigan is now at 15.2% unemployment, which could be pushing the broader number up close to 30%. What this means is the situation is still much worse than DC is letting on – whether they are ignorant or hiding this is irrelevant. They still are not facing up to reality.

Today the NY Times had another fit of professional journalism and noted another important fact – people are rapidly running out of unemployment benefits because this recession has been so long and so deep:

Over the coming months, as many as 1.5 million jobless Americans will exhaust their unemployment insurance benefits, ending what for some has been a last bulwark against foreclosures and destitution.

Because of emergency extensions already enacted by Congress, laid-off workers in nearly half the states can collect benefits for up to 79 weeks, the longest period since the unemployment insurance program was created in the 1930s. But unemployment in this recession has proved to be especially tenacious, and a wave of job-seekers is using up even this prolonged aid.

Tens of thousands of workers have already used up their benefits, and the numbers are expected to soar in the months to come, reaching half a million by the end of September and 1.5 million by the end of the year, according to new projections by the National Employment Law Project, a private research group.

Click the image to enlarge, and read the whole article at NY Times – it contains very important information.

These victims of the recession touch us all. They are ourselves, or friends, or family members or colleagues. They are the victims of the failed liberal experiment out of DC. They are middle America.

They would not be suffering as much if the liberals had not been so naive to think government was the creator of jobs and wealth and satisfied lives. It is not. At best it adjudicates disagreements, punishes the criminals, provides for the national defense and provides for a suite of safety net services which are funded by the good will of the general population.

When government oversteps these bounds and starts competing with the private sector, or dictating to the private sector what to do, how much people can be rewarded for their efforts, how much wealth they can accumulate, how they must speak to each other, how they will live their lives, then government has become an oppressor. The views of an arrogant minority become the rules by which we all are forced to live.

That is not America. We do not need DC and NY elites to tell us how to live and to succeed and care for each other. This liberal stimulus experiment was meant to prove once and for all the truth about liberal economic fantasies and policies. It did its job in spades. We can now reject said liberal policies based on their abysmal failure. We can also reject the purveyors of these naive fantasies, and relegate such nonsensical thinking back to the children’s cartoons from where they came, the only venue where reality is suspended enough for these policies to be believable.

On August 7th, 2009 and September 11th reality will slam the liberals again, as these are the days when the nation reports the unemployment statistics for the previous month of failure. We cannot afford not to learn the lesson of this teachable moment in history.

23 responses so far

Jul 17 2009

States See Spreading Unemployment Pain: Still No Stimulus In Sight

Published by under Measuring The Recovery

Update: Here is a tragic chart showing 16 13 states with unemployment over 10%, Michigan leading the pack with 15.2%. Many of these states are at or near all time record highs.

America can and should measure the Democrats by their record on the economy and jobs. In fact, I dare anyone to sanely argue why we should not! Here is the source of the data. There is a great US map there were you can roll back to the 2008 election and see the damage done since then. It clearly shows the pain spreading out and deepening.

Major Update: The GOP has come out with a killer add which will destroy Obama’s support:


H/T Ed Morrissey, Bumped to the top because this is the future of America at stake. – end update

Some states are nearing the unemployment bottom of this recession. There is a bottom – we are just trying to plumb for it. The problem is, there may also be a shelf on the way to the bottom, but let’s assume we are now finally starting to see bottom as the monthly drop in unemployment slows down for many states and stops for some. 

However, there are signs in some states we are not done yet, and the rising foreclosure rates and lack of renters means we could be in for more drops in the future. Let’s look at the mind boggling unemployment pain in Michigan, where Obama’s Government Motors has taken over GM and Chrysler to ‘fix’ things:

Foreclosures are expected at elevated levels as unemployment-related foreclosures increase, said James J. Saccacio, chief executive of RealtyTrac.

Even with a host of federal, state and local programs to stop foreclosures, June represented the fourth-straight month with more than 300,000 filings nationwide, he said.

Foreclosure activity isn’t over in Michigan, either. The state’s unemployment rate of 15.2% in June could lead to more in the coming months.

15.2% unemployment. The underemployment number (adding those working part time or lower paying jobs to make ends meet) must be will into the 25-30% range. As the article notes this is impacting foreclosures. But the auto industry is a gigantic buyer of goods and services from around the nation. When Detroit sneezes we can all get the swine flu.

What seems to be happening this summer is continued spreading of the problem. It’s like ripples on a pond emanating from some of the worst hit states to date. As the damage spreads it does dissipate a bit, but it does seem to be spreading. Take NJ as an example:

New Jersey’s unemployment rate reached its highest level in 32 years in June.

The jobless rate increased from 8.8 percent to 9.2 percent last month as the state shed 2,100 jobs.

State Labor Commissioner David Socolow says the loss is the smallest since the recession began in December 2007.

Most of the job loss was in the private sector.

Lots of information here to note. The rate of drop is slowing per month, but it is not reversing. And what little stimulus money that has been spent (more on that at the end) has gone to keeping government bureaucrats in their cozy little jobs doing much of nothing. The private sector (where the vast majority of us work) is the one taking the pounding here.

I posted a sample of state unemployment yesterday, showing the spread of unemployment like a cancer across the nation. Today we can add historic unemployment in Kentucky, Idaho and Illinois. Is the stimulus package working? Of course not! The money is not getting out of the lethargic and bloated federal bureaucracy. The latest numbers on the 6 federal organizations I have been tracking is as abysmal as it has been for the last 5 months since the liberal stimulus-pork experiment was rammed through Congress. Here are the charts as of last week (July 10th, 2009).


In the first graph there are 4 sets of columns showing: (from left to right) (1) the amount budgeted for stimulus programs in that organization, (2) the amount allocated to specific programs, (3) the amount actually spent creating jobs (the bottom line) and (4) the amount unspent from the total budget. (click image to enlarge)

The second chart translates the dollar amounts for the last three sets of columns into percentages of the budgeted amounts. (click image to enlarge)

Bottom line: around 99% of the job-creating money for these departments/agencies is stuck in the government coffers – doing nothing. Here’s the latest summary across all 6 organizations:

  • $105 billion was budgeted across the organizations to start new programs and create jobs (the largest amounts going  to the Departments of Energy and Transportation)
  • Of that, only $30.9 billion (was $28.4B) as even been allocated to programs to be spent (29%)
  • The total amount actually spent to date on stimulus programs: $0.987 billion (was $0.606B), which is a paltry 0.94%.

The Department of Transportation is well ahead of the other organizations in that it has 44% of its money now obligated to actual programs. All the rest are way behind in their percent allocated. But DoT still has only spent 1.5% of the money budgeted by Congress. Five months since passage of the stimulus money and less than 1% is actually stimulating job creation.

Karl Rove noted yesterday that Obama said he would be measured by how well his liberal economic stimulus experiment would create jobs:

In February, Mr. Obama said this about the goals of his stimulus package: “I think my initial measure of success is creating or saving four million jobs.” He later explained the stimulus’s $787 billion would “go directly to . . . generating three to four million new jobs.” And his Council of Economic Advisors issued an official analysis showing that the unemployment rate would top out in the third quarter of this year at just over 8%.

Now that he has failed miserably, President Obama is trying to change the gauge to measure him by:

White House officials told reporters the stimulus was to be applied over a two-year period to “cushion” the impact of the worst economic crisis since the Great Depression of the 1930s. They said the plan should not be prejudged by simply brandishing the latest unemployment numbers.

“I feel very confident that the American people understand that it will take a very long time to get out a very, very deep hole,” said White House spokesman Robert Gibbs.

How pathetic. The liberals in DC screwed up royally and now, while millions of Americans are unemployed or underemployed, they claim it is not their fault. Heck, VP Biden was out claiming all is well! Truly pathetic.

The only thing the liberals have done is wrack up massive debt this year WHILE not even spending stimulus money! Look at the new deficit projections for the Government Fiscal Year 2009 (ending in September) which will hit a stunning $1.84 trillion:

We have the data DC. We can see the spreading unemployment. We can see the lack of stimulus spending. We can see the rising debt. We can see the failed liberal experiments producing nothing while we go bankrupt. Does DC really think the rest of the nation is that stupid?

Addendum: record unemployment also in Nevada, Georgia, and South Carolina. Still awaiting the news from California which should have been out today. Maybe it was their furlough day.

17 responses so far

Jun 06 2009

Obama’s Change: A Recession Much Worse Than The Carter Years

As if the situation could not look any bleaker on the economic and job front than what I posted yesterday, a found disturbing chart on a left leaning blog site, amid a lot of concern the job situation is going to be a real political albatross for Obama and the Dems. Here’s the chart comparing this recession to others over the last 30 years (click to enlarge):

(H/T Mathew Yglesias) The crashing red line is the current situation, which was promised to be avoided by the dems when they passed their risky, liberal, economic stimulus experiment back in February.

There are some things to note on the graph. The current recession is far worse than any before – which makes it worse than the Carter years and the disastrous liberal economic experiments they tried back then. It is deeper than any in the last 30 years and will be longer than any other because it has not yet really bottomed out jobs-wise. 

Here are some of the concerns voiced in the accompanying article:

Widespread job losses continued in May, pushing the economy toward a number of dubious achievements. Long-term unemployment is now at an all-time high, jobs have declined for a record number of consecutive months, work hours are the shortest since the Bureau of Labor Statistics began tracking the data, and many other indicators of labor market distress are at or near historic levels.

… 

It is good news that the rate of job growth has slowed, but you would need rose-colored glasses to claim that the labor market is anything but grim and the economy isn’t mired in recession. The American Recovery and Reinvestment Act is beginning to pump money into the economy—$43.7 billion has already been spent—but job growth will take more time.

Unlike the sugar coated ‘all is well again!’ BS from the naive news media, this is a brutally honest assessment. It is becoming crystal clear the liberal experiment of using the government to stimulate economic growth is an abysmal failure.

If job losses continue next month, which is quite likely, the economy will set another all-time mark for months of consecutive job losses. Nearly two-thirds of the unemployed—65.4 percent—are out of work because they lost a job, a number higher than at any point since the BLS began tracking that data.

And once people lose their job, they are having a very hard time finding a new one and are likely to remain unemployed for a long time. Nearly 4 million people have been unemployed for more than 27 weeks—another record. And the percentage of unemployed people who have been without out a job for over six months is also near record levels at 27.0 percent, despite the fact that employers have been shedding jobs at a record rate over the past few months. 

Coming from a left wing site this crashing realization is a good indicator that America may finally be awakening from its fantasy day dream that was the return of the Democrats to power. The key issue is jobs and the economy – and the Democrats have failed to do anything but make things much worse.

As I noted in the previous post there is a great graph out showing the Democrats’ promise verses the reality of jobs losses since the stimulus bill was passed:

Can it be any clearer? The democrat social experiment is a huge failure. It did not perform as promised.

And why is that, some might ask? Simple. The Dems relied on the federal procurement process, as slow and sluggish as it is, to ‘stimulate’ the economy. The left had fantasies of another FDR moment, were they were creating make-work federal jobs and becoming the saviors of the American worker.

The problem is they forgot that this is not FDRs federal government from before World War II. This is the bloated and constipated liberal bureaucracy that grew like a cancer after World War II. It is today a slow, ponderous and lethargic beast – not the slim young pup of the 1930’s.

It will take many months or more for the money allocated in February to start hitting the streets in any significant amounts. Most people who know the bloated beast that is the federal government don’t see any real money flowing until after September. Especially now that we are heading into summer and all the bureaucrats are going to go on their long summer vacations!

I have been tracking the stimulus money as it flows through 5 departments and one agency. As of 6/2/09 (I updated the graph since the previous post, though it is hard to tell since no money is moving out into the economy) the situation on the ‘shovel ready’ jobs is this: the government is still not ready!

The far left columns show the amount of stimulus money budgeted for these 6 government entities – that is the stimulus money meant to create jobs. The center columns represent the amount assigned to specific projects or programs; this is where the bloated bureaucracy has finally determined where and how to spend the money. The last set of columns on the right (which are basically flat lined) is the money heading out of the bureaucracy and being spent to create jobs.

The totals and percentages for the money budgeted, obligated and dispersed as of 6/2/09 are as follows:

  • $105,335,650,000 budgeted (~1/3rd total stimulus ‘jobs’ package)
  • $19.9 billion obligated (19% of the budgeted total)
  • ~$201 million dispersed to actual work (0.2%).

As of today over 99% of the job creating stimulus money in these organizations has not been spent! This is why tax cuts are the only way to stimulate economic growth and job creation – the money is in the economy to start with, tax cuts leave it there to do its magic.

The liberal fantasy of recreating the 1930’s liberal programs is a failure (as it was back in 1930 for the most part). A $787 billion dollar stimulus package was passed, and it did nothing but create more national debt.

Assuming 300 million men, women and children live in this country it would have been quicker to hand each $2,623 instead of the democrats risky and failed experiment. Another way to look at it is by US households, which currently number around 117 million according to the US Census Bureau. If the $787 billion had just been dispersed to each household it would equal $6,726 paid to each! But no, the Democrats had to buck history and avoid the tax cut path. They had to prove they could use the government to direct the nation’s economy.

It was a foolish experiment and they knew the results would not be as advertised. They know how slow their government beastie really was, which is probably why they made a third of the ‘stimulus’ bill assistance to people out of work and in need. They knew they could never get the money out in time to make a difference this spring or this summer. What they did not expect was things would be so bad it would be well into next year before any serious signs of recovery will show up – definitely not this fall as they promised!

Yes, it will be well into the 2010 federal election cycle before this economy could start to turn back up. And by that time, if their opponents can stay focused and reasonable, the Democrats will have been tarred with the abysmal failure of their social experiment as they face the voters.

Update: I was alerted by reader Steve55X1 that under the early Clinton era definitions of unemployment (which included those not looking for work any more) today’s unemployment is more like 20%. That would make the above chart comparing recessions under a common unemployment formula 2-3 times worse.

7 responses so far

Jun 02 2009

Have You Sacrificed Your Career And Life’s Work For Obama’s Liberal Economic Experiment?

This post was originally titled “Obama’s Lies On Economy Getting Out Of Control – Where Is The Job Creating Stimulus?” But it was lost over the weekend after the murders committed by the left and right fringe (see here and here) pushed the post down ‘below the fold’.  Comments by President Obama yesterday regarding the GM-Government fiasco reminded me of why I wrote this post in the first place – the failing and risky liberal economic schemes now destroying American dreams:

“The GM of the future will be different than the GM of the past,” Obama said in a speech at the White House, flanked by his top economic advisers. “I am absolutely confident that if well managed, a new GM will emerge that can provide a new generation of Americans with the chance to live out their dreams, that can out-compete automakers from around the world. 

Obama usually sugar coats things to the extreme. When he announced the pork laden ‘stimulus’ package he made it sound like everyone would be getting right back to work (didn’t happen, did it). His comments about the economy recently have been naively Pollyannish (or cleverly misinforming).

But here Obama is making it clear this generation will not see a new GM. This generation of workers will not live out their version of the American dream. And that is if things are well managed, and as we see below this administration has not managed things well.

And gets worse:

Obama also addressed workers at plants and dealerships who will lose their jobs as part of the restructuring, warning that “more jobs would be lost,” and adding they were “making a sacrifice for the next generation.”

It’s “a sacrifice you may not have chose to make, but a sacrifice you are nevertheless called to make so that your children and all of our children can grow up in an America that still makes things, that still builds cars, that still strives for a better future,” he said.

I usually don’t fall for the “Dear Leader” stuff, but this time I can’t help but note how the jet setting Obama’s  (Tens Of Thousands Of Taxpayer Dollars For A Date?) are clearly not sacrificing a damn thing while President Obama has volunteered hundreds of thousands to sacrifice their lives to his liberal economic experiments.

This is just incredible arrogance – telling Americans they must sacrifice for the next generation. He knows this economy is not coming back anytime soon. He knows that stimulus money is still stuck in the federal bureaucracy (see below). He knows the massive deficit spending is about the send us over another economic cliff. (update: one estimate as the price of the date at $250K!)

He knows and he just wanders off to party, like Nero watching Rome burn. Two examples of men who took on leadership roles way above their grasp.

Original Post: Tax cuts are the only mechanism for immediate economic stimulus. The minute the federal government says companies and individuals will PAY lower taxes, the withholding rates are adjusted and the new money flows into the economy. That is because, as we should all know, that we prepay our taxes throughout the year, either through the weekly paycheck withholdings or the monthly corporate prepayments. Tax cuts are immediate stimulus because we keep that money, it does not get shipped to DC where it wanders around the bureaucracy for months or a year before popping out the back side.

Federal ‘make work’ programs are one of the slowest ways to stimulate the economy. It takes years to move money through the constipated bureaucracy, 6+ months at its most nimble. It is like comparing a massive train accelerating from 0-60 mph (the bureaucracy) and a high end sports car (tax cuts). There is no doubt which is quicker.

And this fact of modern, bloated bureaucracies is why the democrats have failed to fix our economy and create jobs. This is not FDRs federal government with layers of ecological, equal opportunity, competitive bidding, minority access (etc, etc) processes in place.  The liberals in DC promised if we rammed through massive deficit spending we would save people from economic chaos. They lied.

And they continue to lie to this day, pretending everything is turning around:

President Barack Obama says the economy has stepped away from the verge of calamity and Americans are calmer about the future.

Hitting bottom is not stepping ‘away from the verge of calamity” – it is simply hitting a point of temporary stability. It is not getting as bad as fast as it was, but it is not getting better either. It is still gliding downward, albeit at a slower rate.

The problem is this: what has been done to make this an actual bottom from which we can rise off of? What policies have been put in place to make sure we don’t just slide at this slower rate farther down the hole for months and years to come? Is there another cliff in front of us we need to ‘step back from’ before we start another crashing downturn? Are the current policies going to turn this around, or are they actually going to send us over that next cliff?

I fear it is the latter, and so do a lot of other people.

For the first time since another Democrat occupied the White House, investors from Beijing to Zurich are challenging a president’s attempts to revive the economy with record deficit spending. Fifteen years after forcing Bill Clinton to abandon his own stimulus plans, the so-called bond vigilantes are punishing Barack Obama for quadrupling the budget shortfall to $1.85 trillion. By driving up yields on U.S. debt, they are also threatening to derail Federal Reserve Chairman Ben S. Bernanke’s efforts to cut borrowing costs for businesses and consumers.

The 1.4-percentage-point rise in 10-year Treasury yields this year pushed interest rates on 30-year fixed mortgages to above 5 percent for the first time since before Bernanke announced on March 18 that the central bank would start printing money to buy financial assets. Treasuries have lost 5.1 percent in their worst annual start since Merrill Lynch & Co. began its Treasury Master Index in 1977.

We have not stepped back from the edge, we are actually just passed one edge and looking at the abyss of another. If the credit market tightens up the economic growth will go through another round of constricting. Another round of constriction and dominoes will start falling again as more jobs dry up, more industries go under, more tax revenues fall.

The only way to stop this from happening is for that mythical stimulus to kick in – but it hasn’t and it won’t. It can’t. The constipated federal bureaucracy cannot move money through its bloated processes that fast. And it shows.

First, it shows in the meager amount of ‘shovel ready’ stimulus money dripping out of the federal government (click to enlarge):

I have been tracking $105 billion dollars of the $300+ billion stimulus money crammed through congress in February. I have been keeping tabs on 5 Departments and 1 Agency which represent one third of the stimulus money, including the two primary departments of Transportation and Energy which the Democrats targeted for the largest portion of the stimulus spending.

The far left columns show the amount of stimulus money budgeted for these 6 government entities – that is the stimulus money meant to create jobs. The center columns represent the amount assigned to specific projects or programs; this is where the bloated bureaucracy has finally determined where and how to spend the money. But it is not going anywhere yet. The last columns on the left (which are basically flat lined) is the money heading out of the bureaucracy and being spent to create jobs.

The totals and percentages for the money budgeted, obligated and dispersed as of 5/21/09 are as follows:

  • $105,335,650,000 budgeted (~1/3rd total stimulus package)
  • $15.8 billion obligated (15% of the budgeted total)
  • ~$75 million dispersed to actual work (0.071%).

Here we are coming on 4 months since the stimulus bill passed and nearly all the money is still stuck in the bowels of the federal government, losing its total value as the bureaucracy sucks off its handling fees. There has been basically NO economic stimulus from the so called stimulus bill to date.

This is why the democrats have failed to do ANYTHING about jobs – the second indicator things are not really turning around. Our tax money is sitting in the government being eaten up. Look at the history of job losses so far this year:

Does this look like we are heading in a better direction? Does this look like we have stepped back? Hell no, it doesn’t!

But it is even worse than that if you look at what President Obama and the Democrats have done to we average Americans in this major economic screw up. While the jobs money is stuck in the bureaucracy, the federal government is charging all of us for the deficit spending they are gorging on at the moment, racking up our personal debt to the government at a mind boggling rate. I cannot copy the graphic here, but everyone needs to follow this link and look at how much each household owes thanks to the Democrat liberal policies enacted only 4 months ago:

Taxpayers are on the hook for an extra $55,000 a household to cover rising federal commitments made just in the past year for retirement benefits, the national debt and other government promises, a USA TODAY analysis shows.

Got that? We all now owe Uncle Sam another $55,000 dollars per household! Per household! According to the US Census Bureau, the median household income for 2007 was $50,233.00. So the democrats in Congress and the White House have basically racked up 100% of the average household income in future debt. Gee, thanks guys and gals in DC!

And we all should know the median income levels are dropping since the recession hit in late 2008. So how bad is it right now? The best indicator for that right now is tax revenues (our 3rd indicator  of a suppsed economic turn around), which are a sign of personal and corporate income. That indicator is looking damn bleak:

Federal tax revenue plunged $138 billion, or 34%, in April vs. a year ago — the biggest April drop since 1981, a study released Tuesday by the American Institute for Economic Researchsays.

For example, 6 million people lost jobs in the 12 months ended in April — and that means far fewer dollars from income taxes. Income tax revenue dropped 44% from a year ago.

“These are staggering numbers,” Lynch says.

All the more staggering because the Democrats and President Obama already forecasted frightening levels of deficit spending for months and years to come, all the while assuming a fantasy turnaround on the economy which would be running at a ridiculous +4% by the end of this year. The following chart shows the Obama promise and the CBO numbers which have been proven to be more realistic. The question is now, how much worse is it really?

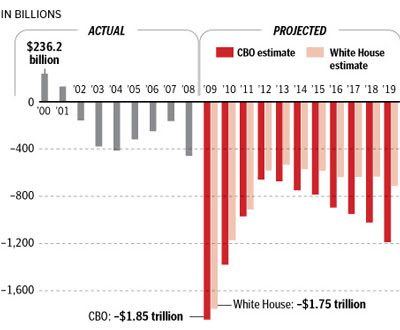
This economic BS from the Dems can be emphasized by noting that we are currently have a negative economic growth (shrinkage) of 5-6%. To get to their rosy numbers would be a never before seen swing of 9-10% in economic growth in a few short months. Which means that graph above is basically unrealistic. The real economic picture will be much worse than that.

There will be no economic growth with tightening credit and the stimulus money being held hostage in the federal bureaucracy. There needs to be SOMETHING to stimulate growth and there is nothing there. So where is the stimulus money? Where are the policies to stop us from sliding further? Apparently what little is getting out is going to districts and areas who need it the least:

States hit hardest by the recession received only a few of the government’s first stimulus contracts, even though the glut of new federal spending was meant to target places where the economic pain has been particularly severe.

Nationwide, federal agencies have awarded nearly $4 billion in contracts to help jump-start the economy since President Obama signed the massive stimulus package in February. 

This is another must read article because it shows how little money the current stimulus of $4 billion really is in an economy which is around $10 trillion dollars total. (note: these state level funds provided by the Feds may not the same as the funds I noted in the graphs above for federal government entities I have been tracking).  Check out these per capita numbers compiled by USA Today:

In Michigan, for example — where years of economic tumult and a collapsing domestic auto industry have produced the nation’s worst unemployment rate — federal agencies have spent about $2 million on stimulus contracts, or 21 cents per person. In Oregon, where unemployment is almost as high, they have spent $2.12 per capita, far less than the nationwide average of nearly $13.

21 cents!? $2.12! This is going to create jobs? Why not give people a $10 dollar tax rebate and REALLY stimulate the economy. Why not give everyone a $50,000 tax cut (the amount of new debt added per household) and really do something? This is the fallacy of the liberal mindset that thinks federal programs are better than letting people keep their money and spend it where they need to.

This will be history’s grand liberal experiment which fails so miserably that it deals the death blow to liberalism. Sadly, we had to learn this lesson the hard way, by direct and painful experience. Everyone wanted a quick and easy and painless fix. Soak the rich, redistribute wealth. We wanted Obama to wave his magic wand and make it all good again. So naive.

Well here’s a new lesson on the reality of economics. Wealth and debt are redistributed equally, it all depends on the economic conditions which are in play. In good times – with economic growth-  wealth is distributed. It all trickles down, whether from taxes or from economic growth.

We don’t live in those times. So now the liberals are redistributing the economic disaster onto our backs. The average household now has two debts to pay off: what it owes personally that it took on itself, and what it owes the government because pols can’t control their spending while using our money. This federal debt is what DC took out in our name.

If one looks at one of the key links above they will learn this inconvenient truth: the average household has $122,000 in personal debt. But they also owe an additional $547,000 in federal debt – and it is rising at an unsustainable rate. With median household incomes around $50,000 the federal debt is equivalent to taking 11 years of income away from the average household. We now all owe Uncle Sam a decade of financial servitude to the incompetence of Congress and this White House. We must work for a decade to pay back their screw ups!

This is the change Obama and the liberal Congress have wrought, they have stolen a decade from each of us to fund their failed liberal experiments.

And these people have only just begun to bankrupt us. To see what America will look like if we don’t stop them from this madness and their lies, look at what California is facing after decades of similar uncontrolled bureaucratic incompetence:

Faced with a ballooning deficit and a clear signal that voters won’t pay more to fix it, California Gov. Arnold Schwarzenegger released a budget plan Tuesday that would eliminate welfare, drop 1 million poor children from health insurance, cut off new grants for college students and shut down 80 percent of state parks.

Have we stepped back from the brink? Hell, we have just barely put our toes into this mess. As the start of this post noted, as long as deficits climb out of control (and they are faster than anyone can fathom right now) the longer we will be in this economic hell whole. 

If only we had just lowered taxes and let the economy do what it does naturally. If only we had not believed in the liberal fantasies of the 1930’s and just faced up to the reality of the first decade of the 21st century.

16 responses so far

Apr 01 2009

Finally, A Fiscally Responsible Plan – Updated!

Published by under All General Discussions

There are some voices of sanity left in Washington DC, and thankfully this voice is coming from the conservative side:

House Republicans are calling for the economic stimulus package passed in February to be rescinded starting in 2010 as part of their alternative to President Obama’s budget blueprint.

After being criticized last week for lacking specifics in their budget rebuttal. the Republicans said Wednesday they also want a freeze on non-defense spending and a moratorium on earmarks for Congress. 

“This is a budget with real policies and real numbers,” said Rep. Paul Ryan, R-Wis. “We’re going into an ocean of red ink in this country. There will be a time when others won’t buy our bonds.” 

Compare this to the insanity of the Democrats (H/T Gateway Pundit):

#1 .Under the Obama budget, the Congressional Budget Office (CBO) projects that the national debt will double over the next five years; and it will triple over the next 10 years to $17.3 trillion.

#2. Under the Obama budget, CBO projects that the national debt will soar over the next 10 years from 40 percent of GDP today to a shocking 82.4 percent. (Ronald Reagan left office with the national debt at 42 percent of GDP).

The right path forward is obvious and clear – bankruptcy or recovery.

Update: As if it could not be any worse:

The U.S. government and the Federal Reserve have spent, lent or committed $12.8 trillion, an amount that approaches the value of everything produced in the country last year, to stem the longest recession since the 1930s.

New pledges from the Fed, the Treasury Department and the Federal Deposit Insurance Corp. include $1 trillion for the Public-Private Investment Program, designed to help investors buy distressed loans and other assets from U.S. banks. The money works out to $42,105 for every man, woman and child in the U.S. and 14 times the $899.8 billion of currency in circulation. The nation’s gross domestic product was $14.2 trillion in 2008.

I will never, in my lifetime, see the end of this red ink.

Update: Yeah, this picture looks MUCH better:

SInce it is us, the American taxpayer, who need to burn off all this debt (through the next 2-3 generations) the GOP is finally proposing a preferable and mature alternative to the Democrats’ panic spending mode.

35 responses so far

« Prev - Next »