Oct 23 2016
Florida Early Voting Data Shows GOP Ahead Of 2012, Part 2
In Obama’s 2012 reelection the Democrats produced more “early voting” ballots in Florida than the GOP did (obviously these are not votes for a candidate, but simply ballots by party ID). They led the GOP by 3% last cycle.
Florida [2012]
Votes: 4.3 million
Democrats: 43%
Republicans: 40%
That edge in early voting no doubt helped push Obama over the top in Florida to beat Romney:
 |
 |
| Popular vote | 4,237,756 | 4,163,447 |
|---|---|---|
| Percentage | 50.01% | 49.13% |
Note the actual vote difference in 2012 was very small = 74,309 votes. The early voting ballot tally for the Dems represented a lot more than the final difference (129,000 ballots). Keep this in mind as we look at this year’s data.
This year the FL Democrats ARE NOT doing as well as they did in 2012 in early voting (per this site). This year the GOP is ahead in ballots requested AND ballots returned (so far). The table below is the data from the FL site with additional information (click to enlarge):
[New from previous post]
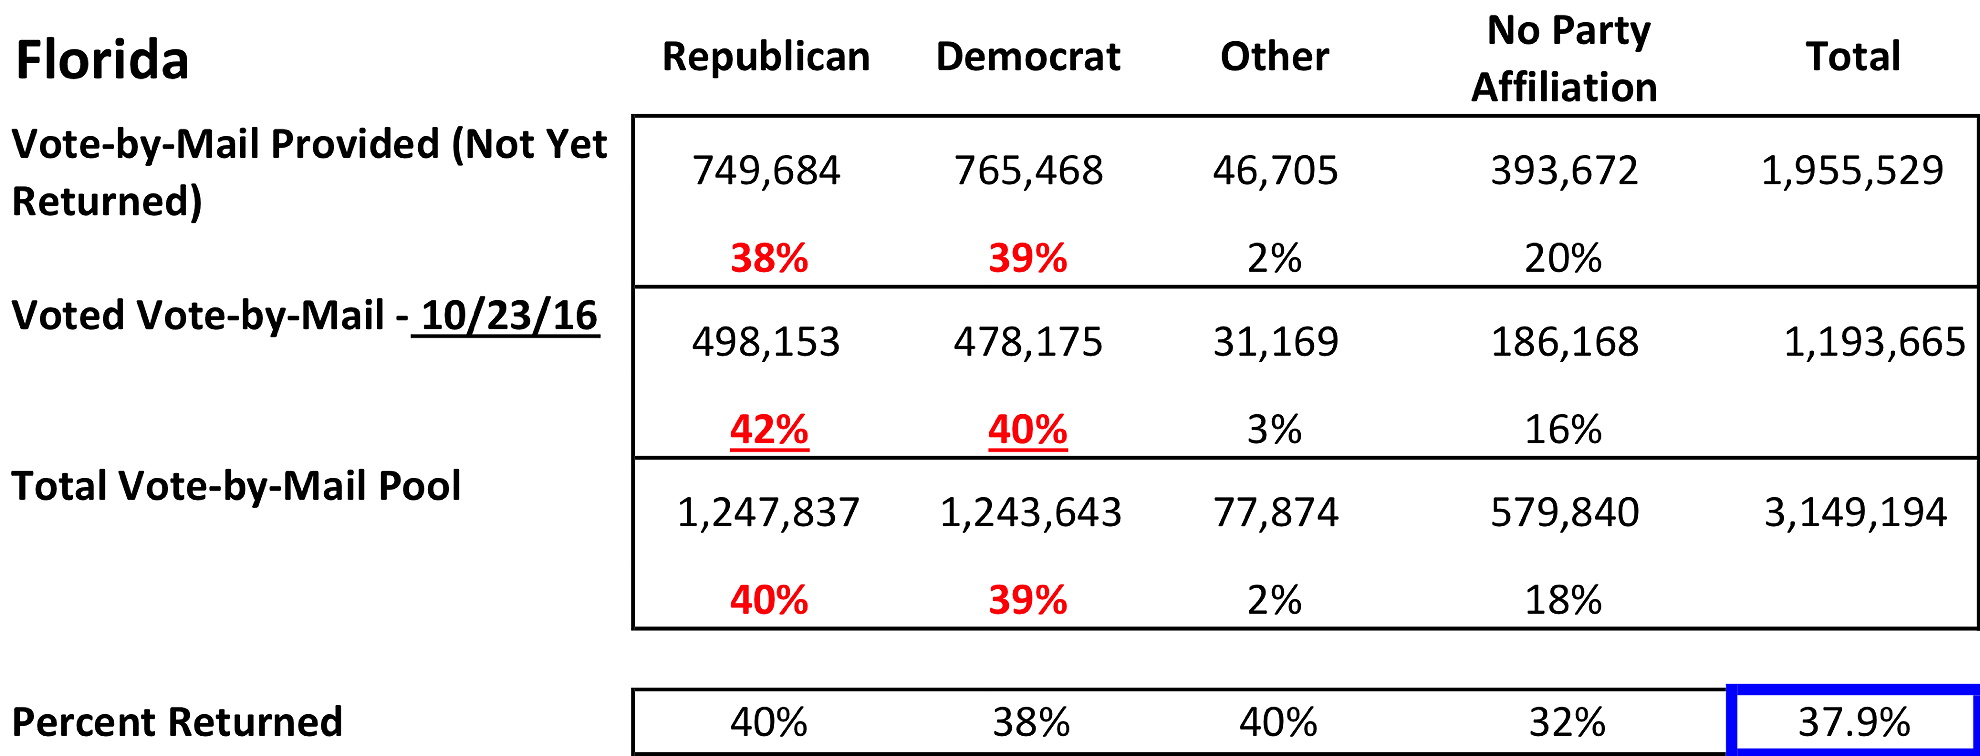
There is a lot of information here, so let’s walk through it. Florida reports two rows of data everyday. The top row is the number of ballots requested, but not yet returned. The second row is the number of ballots returned (= votes cast by Vote-by-Mail).
Everyday both rows change. So to compute the total potential ballots you need to sum the first two rows, which I did in the 3rd row. I added the percentages so you can see how the ballots break down by party affiliation.
The blue box lower right shows how much of the total potential ballot pool has been received as a submitted vote (who the vote is for is unknown). These ballot tallies are the same data as from 2012 above – they are not votes (yet). As of today about 38% of the ballots have been returned.
Some bottom line findings (highlighted in red in the table):
- The GOP pool of potential ballots is larger than the Democrats 40-39% (3rd row %)
- The GOP has returned a higher percentage of ballots requested than the Democrats 42-40% (2nd row %). This is confirmed in the last row as well which shows % returned by party affiliation. This indicates some intensity on the GOP side
- Not surprisingly, the Democrats have a higher number of requested ballots not yet returned 39-38% (1st row %). This is also confirmed in the last row which shows % returned by party affiliation. This could indicate some ambivalence in the Democrat voting.
If you think the last bullet means the Dems can catch up by submitting more ballots later, I would have to point out that they can never “catch up” (as of now) because the GOP has the edge in total ballots requested (first bullet).
So are the Dem strongholds of Boward and Miama-Dade counties holding a potential reservoir of late breaking ballots that could close this gap? I had a look and the answer is – probably not.
First, let’s focus in on Broward county using the same table (data is from the same FL State website):
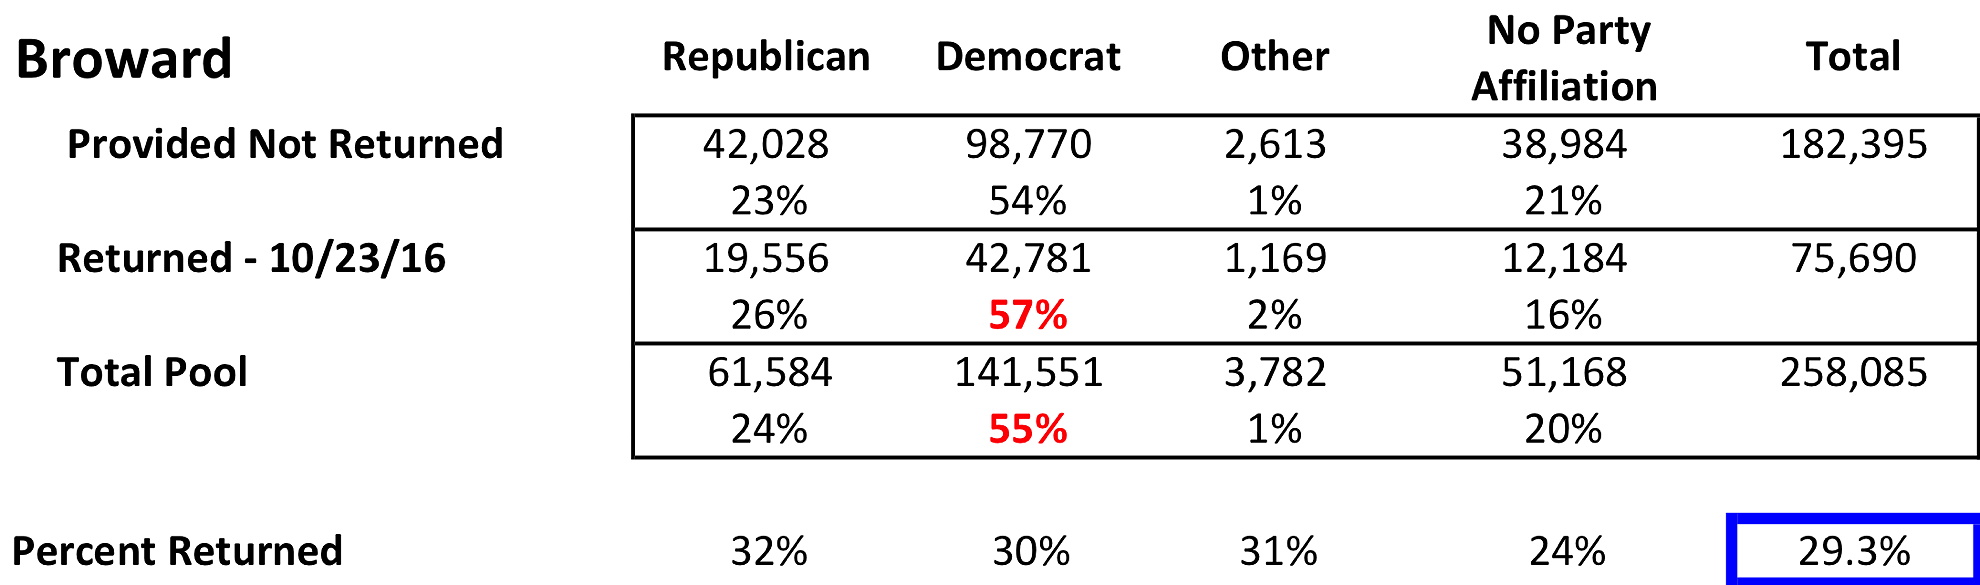
If we first look at the Total Pool of ballots as of today (3rd row) Democrats as expected have a huge edge in total ballots 55-24%. They are returning ballots in higher numbers than the GOP (2nd row), but as a percentage of their total pool they are running behind the GOP 32-30%. Yes, Broward does have a pool of “not yet returned” ballots that is larger than the GOP pool, but it is unclear if they will catch up in percentages. Nearly 30% of Broward ballots are in as of today.
Note that the huge edge in Dem Ballots in Broward are already part of the state-wide numbers above. So while the Dems could do better in Broward, they cannot yet bridge the gap with the GOP.
Now Miami-Dade:
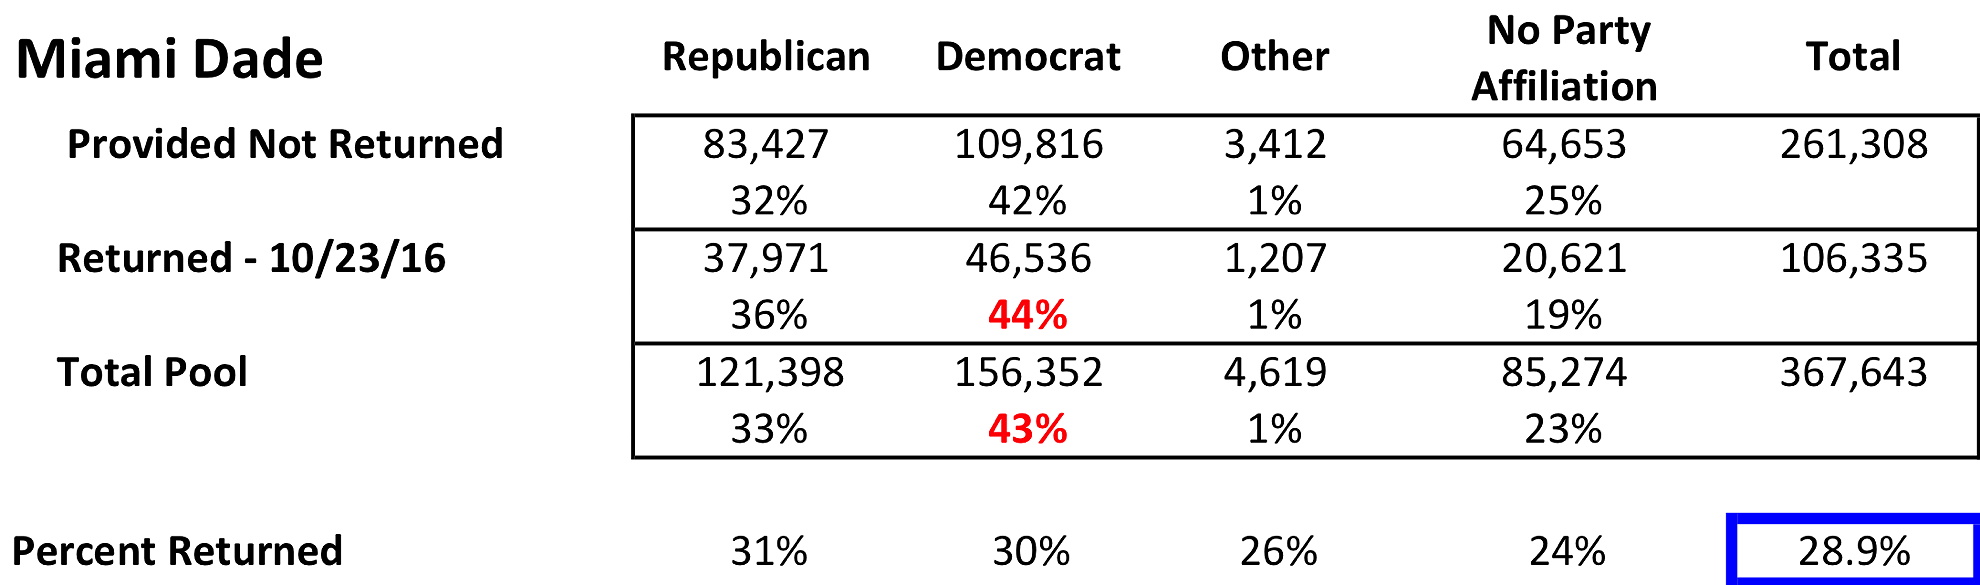
The first thing to note is Miami-Dade county has the largest voter/ballot pool in Florida by far. But unlike Broward, the Democrats represent a smaller fraction (Miami-Dade = 43%; Broward = 55%). The GOP is conversely stronger in Miami-Dade (Miami-Dade = 33%; Broward = 24%). So while Miami-Dade is larger it will not produce as much of an edge for the Democrats as Broward.
So what do we see here. The GOP and Dems are returning ballots at about the same level (last row). The GOP is running ahead in returned ballots in terms of their portion of the total pool. They represent 33% of the total pool, but they represent 36% of the total ballots returned (2nd and 3rd rows). The Democrats are only slightly higher in returned vs total pool. This again indicates a higher level of voting in the GOP ballots than in the Democrat. So while there are a lot of votes left to be returned, the current trend looks like the GOP has both a hard bottom line edge (more ballots out), but an intensity edge (more GOP ballots showing up “returned”).
Summarizing all of this it looks nearly impossible for Clinton to perform anywhere near Obama’s 2012 levels in early voting. As noted at the top of this post, 2012 Obama barely squeaked out a win (74K votes out of 8.4 million). Even a tiny under-performance by Clinton in 2016 could tip Florida to Trump.
Finally, if early voting trends are an indication of the voting trends on election day (big leap here), then it would appear that Florida is not in play, as the polls show. The large Democrat strongholds in Florida are showing an intensity gap similar to that seen state-wide, which does not indicate a Clinton win.
The hard data of early voting ballots clearly is at odds with the current polls (today a 3.8% lead for Clinton). Yes, I guess Clinton could be pulling in some unaffiliated voters (the 3rd largest ballot pool), but one would think she would also have a lead in the Dem vs GOP battle if this was the case. I doubt Florida is safely in the Democrat column, and could argue it is in the Trump column right now.


[…] In a post later today I will show why I think the turnout models for Florida are incorrect based on the Vote-by-Mail statistics. (Update: here is the post) […]
Good crunching here AJ. I did a bit of it myself a week or so ago with similar results.
One variable I wish we had was the historical request % of Independents and other.
I wonder if results hold if you apply the % of Indies against the break to D or R from standard polls– just to see how the splits change.
Because one thing is certain, D/R is down this year and I are way up. Presumably these candidates have driven people to renounce their affiliation but I doubt it fully changes their voting characteristics.
Chikung69,
I was thinking the same thing. As of now the combined D + R in ballots is 79% for 2016. In 2012 they combined for 83%. So the other parties are showing a higher turnout – which I seriously doubt is in Hillary’s favor
AJ,
Put another way, after crunching the top 14 Counties, which cover 73% of all total requested, the advantage is quite pronounced for the GOP in “less” drop offs from 2012 levels than the dems.
Miami Dade (367,619), the Requested Advantage GOP=14%, Voted=16%
Pinellas (288,549) Requested Advantage GOP=6%, Voted=4%
Broward (258438) Requested Advantage GOP=4%, Voted=4%
Hillsborough (216,256) Requested Advantage GOP=1%, Voted=0%
Orange (197,149) Requested Advantage GOP=0%, Voted=1%
Lee (170,653) Requested Advantage GOP=8%, Voted=7%
Only until you get to Palm Beach does the pattern break
Palm Beach (177,889) Requested Advantage GOP=(5%), Voted=(5%)
And then it wavers between parties from there.
Also, looking specifically at Miami Dade, the drop in Request/Voted for the Dems is (19%)/(18%) vs GOP (5%, 2%)
Miami dade went 540,776 Obama vs 332,602 Romney in 2012.
Margin of Miami dade victory was 208,174 for Obama
Applying the drop,
The comparable 2012 in 2016 would be:
Dems 438,029 (81% of Total)
(102,747) Lost Dem Votes
GOP 315,972 (95% of Total)
(16,630) GOP lost votes
The net loss Dem vote from extrapolated Miami Dade alone = (86,117) Net.
Obama won Florida by 73,189 votes.
So I find it hard to believe that HRC is leading FL by 4% in the RCP Polling.
Regards,
Chikung
[…] guess is these polls reflect the dearth of GOP respondents to the pollsters. As I have noted in my Florida early-voting posts, it is the Dems who have a problem with turn out and returning ballots, not the GOP. The GOP is […]