Dec 07 2009
CRU’s Apparent Temperature Input To Briffa-Osborne Tree Ring Analysis
I stumbled across another interesting set of internal, pre ‘adjusted’ data, made public in the CRU data dump which really has me scratching the ol’ noggin. So I am going to post what I saw then link to this at Climate Audit and the Air Vent to see if I can get some insights. I have no clue if this is important, but I think it tells another story about the pre ‘adjusted’ CRU temp data.
The files are all of the name “reginstr_[period]_[region].txt” under the path documents/osborn-tree3/ (for those who have the original zip download). Â The [period] is either “aprsep” or “junaug” – which indicates these are for tree ring studies since these are the periods tree rings would show growth depending on latitude and altitude.
The [region] field is one of the following: NWNA (North West North America), SWNA (South West North America), ENA (Eastern North America), NEUR (Northern Europe), SEUR (Southern Europe), ESU (guessing Eastern Soviet Union), CSU (guessing Central Soviet Union) and WSU (guessing Western Soviet Union). There are also [region] fields identified as NORTH (guessing Northern Hemisphere), SOUTH (guessing Northern Hemisphere) and ALL (guessing Global).
The header in each file has the following cryptic explanation:
Regional-mean CRUTEM1 instrumental temperature for [period] for region [region].
All the files have data beginning in 1856, though the records start back in 1600, an indication this is land instrument data. “CRUTEM1” also tells me this is the annual mean temperature anamolies from the CRU pre ‘adjusted’ temperature records. The data end in 1992, though all the files were created at the same time on October 12, 2007. Here is one as an example.
I was trying to figure out what these mean so I started graphing some of the data and what I found was interesting. But I am not sure if it is important (thus the call for help to CA and tAV).
I had no clue what these regions were until I stumbled upon this detailed analysis at Climate Audit – which led me to understand these had to input data to Briffa & Osborne from which to calibrate their tree ring proxies. Just one example of how the regions map to tree ring proxy analysis:

I have speculated that the CSIB (Central Siberia) has been replaced with CSU (Central Soviet Union), etc. There are also other interesting graphs at CA which give me more insight:


Top: From Briffa et al [1998]; bottom – from Briffa et al [2004].
Clearly these data files are what CRU would generate from its land temperature records to provide as inputs to the tree ring proxy studies. So what does it mean?
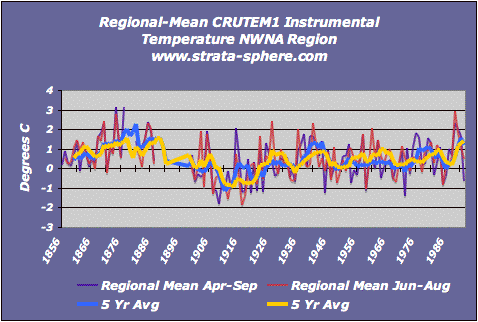
Here is the NWNA graph showing both the April-September and June-August data:
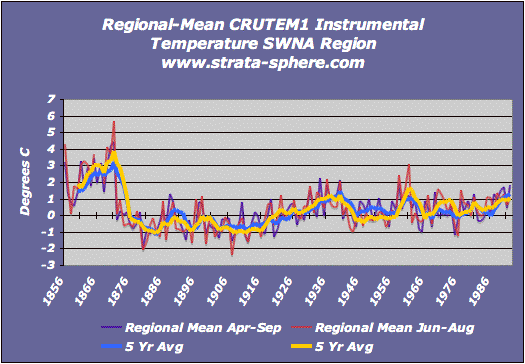
Here is the SWNA graph showing both the April-September and June-August data:
Here is the ENA graph showing both the April-September and June-August data:
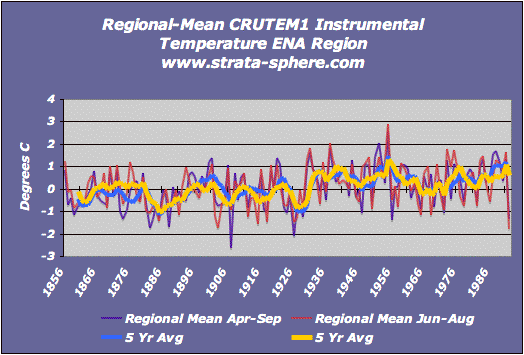
I arbitrarily used a 5 year rolling average to map the trend lines.
What I see is a lot of periods prior to the 1992 cut off, which were (by annual mean) as warm or warmer than the period after 1986. And since the regions do not show a uniform pattern, it is clear the climate change is driven by regional factors – not global ones.
What also is clearly NOT in these graphs is any hockey stick – which is why I am confident these values are prior to any ‘adjustments’. I would suspect Briffa, et al would want to calibrate their tree rings to the raw temp data, not data already massaged to reflect AGW. Though I have no clue why the would use a ‘mean’ and not an actual annual temp value.
Which begs the question – does any of the raw CRU temp data show the hockey stick ‘trick’ (see here for my previous analysis on another raw data set discovered in the CRU data). If not, then we have a strong case the AGW graphs are ‘tricks’ or PR purposes.
I suspect this may be of some importance given the lack of a hockey stick. I am working to graph the other regions and to average the “ALL” by giving each region equal weight (which should be the case).
Look forward to hearing if there is anything in this or not. Comments welcomed!


A. J. I will have a letter to the editor, under my real name, not Blog name appearing in the South China Morning Post in the next couple of days. It has links to your pages.
Thank you for the good work on this. You are a credit to people that want to know the truth about this issue.
[…] The Strata-Sphere: CRU’s Apparent Temperature Input To Briffa-Osborne Tree Ring Analysis […]
Thanks Fai – good luck with your article!
Not sure if this has anything to do with your data, but it sure seems to indicate that the data is being manipulated.
file 1109021312.txt
From: Phil Jones
To: mann@virginia.edu
Subject: Fwd: CCNet: PRESSURE GROWING ON CONTROVERSIAL RESEARCHER TO DISCLOSE SECRET DATA
Date: Mon Feb 21 16:28:32 2005
Cc: “raymond s. bradley” , “Malcolm Hughes”
Mike, Ray and Malcolm,
The skeptics seem to be building up a head of steam here! Maybe we can use this to our advantage to get the series updated ! Odd idea to update the proxies with satellite estimates of the lower troposphere rather than surface data !. Odder still that they don’t realise that Moberg et al used the
Jones and Moberg updated series !
Francis Zwiers is till onside. He said that PC1s produce hockey sticks. He stressed that the late 20th century is the warmest of the millennium, but Regaldo didn’t bother with that. Also ignored Francis’ comment about all the other series looking similar to MBH.
The IPCC comes in for a lot of stick.
[b]Leave it to you to delete as appropriate ![/b]
Cheers
Phil
[b]PS I’m getting hassled by a couple of people to release the CRU station temperature data. Don’t any of you three tell anybody that the UK has a Freedom of Information Act ![/b]
From: “Cooke, Barry”
To: ITRDBFOR@LISTSERV.ARIZONA.EDU
Subject: Re: [ITRDBFOR] Joe Barton’s hockey stick hearing coming up
Date: Mon, 17 Jul 2006 17:46:01 -0400
Reply-to: ITRDB Dendrochronology Forum
“Non-independence” of reconstructions and “worthlessness” of the hockeystick model were raised as separate issues. If the worth of a model is measured by its ability to predict, then a
model that explains 0.5% of the variation in some variable is fairly (but not necessarily completely) “worthless”. Surely, one hopes for better. Especially where consensus is required.
The proxy data on which multi-proxy reconstructions are based may be statistically independent, but the reconstructions themselves are not. This is not because of any lack of “independence” (i.e. objectivity) among networked researchers, but a measurable fact of arithemtic. To the extent that multi-proxy reconstructions are built on the same proxy
data, they are statistically non-independent (i.e. correlated).
i.e. It’s not the non-independence that make the model worthless. It’s the uncertainty.
On your last point of social networks, try a Google search of ‘Exxon Secrets’. The difference between a ruling orthodoxy and a scientific network is not the degree of connectivity, but the mode of governance: coercion & inculcation vs. facts & reason (including statistical inference). Be wary of any science that loathes statistics or resents external investigation. That’s the start of rot.
If Wegman et al. are suggesting that statisticians should be put to work to serve the interests of paleoclimatologists (which they are), then who on this list is going to argue that? I say let’s put them to work!
Barry Cooke
—–Original Message—–
From: ITRDB Dendrochronology Forum
[mailto:ITRDBFOR@LISTSERV.ARIZONA.EDU]
Sent: Monday, July 17, 2006 6:43 AM
To: ITRDBFOR@LISTSERV.ARIZONA.EDU
Subject: Re: Joe Barton’s hockey stick hearing coming up
>Maryanne’s message further claims that the “characterization of the hockey stick as ‘worthless’ underscores what appears to be a basic lack of understanding of how scientific consensus is formed”. Yet if a consensus is based on invalid statistical analysis, then the consensus is wrong.
To explain my point (and my apologies to those to whom this is obvious): it would not be unprecedented for a scientific consensus to be wrong. However, there is also ample precedent for papers containing flaws (which virtually all do, if somebody looks hard enough, or has the misfortune of having the resources of Congress devoted to finding them) to have constructive influence on debate. To take an example from
history, many of Charles Darwin’s observations are pure amateurish nonsense by the standards of even the late 19th century, but no one would doubt their value in building the consensus for evolution. The question is not always strict veracity, but whether work provokes fruitful questions, or leads research in a constructive direction. (By the way, this is not to take a position on the Wegman judgement on the MBH papers).
>Dave’s message further claims that there are multiple “independent lines of evidence” for the hockey stick. The Wegman report discusses this claim. See especially p.46-47, which cite twelve different studies and concludes that those studies “cannot really claim to be independent”.
This part of the report is more precious than useful. In most empirical fields, leading primary investigators have linkages–nothing unusual about that. We could construct similar matrices of social networks in physics, biology, statistics. That doesn’t mean the works produced in physics, biology or statistical theory are “worthless”. A similar point can be made about different investigators using the same proxy data. In
fact, isn’t it one of the recommendations of the Wegman report that the paleoclimate community share data more effectively? Seems that if that recommendation was followed, certain statisticians would have even more occasion to complain of a lack of true independence. Seems these poor climate experts can’t win!
Wouldn’t it be interesting to see a “social network” matrix–or a
funding matrix–between those the scientists, statisticians,
Congressional Republicans, and oil companies most passionate about “debunking” global climate change?
Dr. Maryanne W. Newton
Research Associate
Malcolm and Carolyn Wiener Laboratory for Aegean and Near Eastern
Dendrochronology Cornell University
SBD
[…] Reader SBD points to another Phil Jones ‘trick’ he contemplated playing on an unsuspecting public (and on an extremely gullible and ignorant news media): […]