Nov 24 2009
How To Hide Global Cooling: Delete The “1940’s Blip”
As I and others dive into the CRU data dump we learn more and more about how the Global Warming conspiracy was pulled off. We now know all you need to do to pull this off is statistically cover up true data that tells the wrong story with ‘bad’ data that tells the story you want to have told. Then you compute some statistical correlation factors (which mean you have ‘confidence’ the data is correlated, not ‘proof’ there is a physical connection) and a whole bunch of people with a high school grasp of science run with the new story you want told.
Rinse and Repeat.
In this theatre of the absurd, a couple of stories had to be told to make the case for out of control global warming. First, you have to cool off history because it has been as warm as it is now many times before, and that does not fit the plot. This is where we see issues related to the Medieval Warming period, but also about the ‘1940’s blip’ in the CRU emails  – which turns out to be a real story killer. So after you cool off history, you have to then deal with the fact that global temps are now cooling off even more! So what do you do?
One line in one email from the charlatan Phil Jones at CRU caught my eye and I have been pondering it while I have been looking at the CRU raw temp data. Here it is:
Phil Jones tells Mike Mann and others how he made his data show warming:
I’ve just completed Mike’s Nature trick of adding in the real temps to each series for the last 20 years (ie from 1981 onwards) and from 1961 for Keith’s to hide the decline.
Let’s think about this for a moment. To make it look warm now, Jones added back in the real temp data. The data shows it is cooler now than just recently, yet we put in real data to warm it back up? This could only mean the series before 1980 and 1960 must have been massaged a lot to really cool off something prior to that time. Probably a warming ‘blip’.
Let’s look again at the so called global warming graph from NCDC:
Look at the 1940’s blip here, it is nothing. Was it really this low, or did the CRU con men use statistics to cool it way down, only to have to put the ‘raw’ data back into the later decades to make the temperature appear higher now than in the 1940’s and 1950’s? Well, thanks to the CRU data dump we have some of their temp runs from 2008 and 2005.
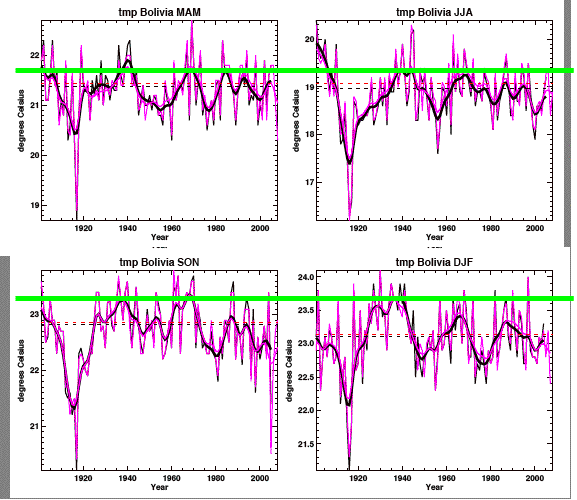
Let’s look at the CRU Land Temp Data from some selected countries around the globe (and yes, I cherry picked them, but it was not hard since all countries nearby these saw similar patterns). First, we go to Bolivia (click to enlarge):
Hmm, doesn’t look at all like the NCDC graph. I have added the green lines to help people line up the pre 1960 peaks with the current time period. Right away one thing jumps out: clearly it was warmer half a century ago than it is now in Bolivia. Is Bolivia an odd case? Let’s check some other countries.
How about Greenland?
Yep, similar pattern – the 1940’s were near or warmer to now in all but one season. OK, lets move to Poland:
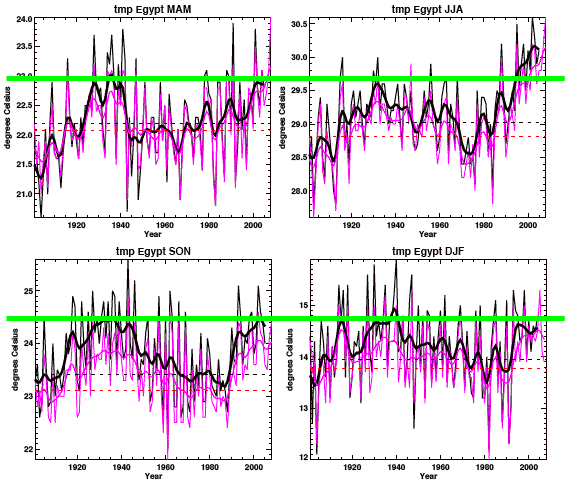
Now that is one flat temperature signal, except that 1940’s blip in JJA. Let’s try Egypt:
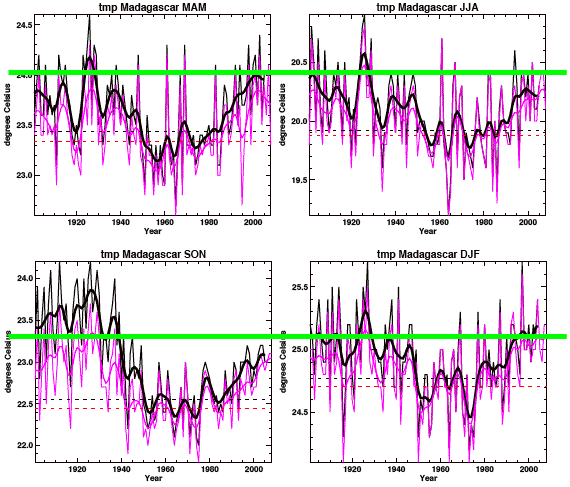
1940’s blips just about everywhere. How about Madagascar?
Wow – It was a lot warmer for a lot longer prior to 1960 than today. Looks nothing like the NCDC graph.
Feel free to look for yourself, here is the file of CRU land temp plots by season (i.e., MAM = March-April-May, Â JJA = June-July-August, etc). The purple lines are the data runs from 2008, the black lines are the same data processed in 2005. The dashed lines are the median temperature for those seasons, again from 2005 (black) and 2008 (red).
So now we understand that email about “Mike’s Nature trick” – of course ‘Nature’ here probably means the data they published in Nature Magazine, claiming to the world there was rampant global warming.
And they wonder why people want them investigated for producing misinformation and conspiracy?


You continue to do an excellent job on covering this scandal. the best news I’ve seen is that Glenn Beck covered it on his show Monday, so now it can’t be covered up.
It’s almost a comedy watching and hearing the alarmists trying to say ‘what I really meant was….’
One human nature trait involved here that I really don’t understand. If I were personally working on any scientific project and I knew for sure my colleagues were dishonest, why would I trust ANYTHING they produced. I’m quite sure, that being the case, if I happened to produce something that ‘didn’t fit’, then they would just modify it to fit. Just what good is ‘scientific data’ that is ‘not’ scientific, but made up?
you know what? that doesn’t just apply to ‘scientific data’ it applies to life. Why would anyone trust a ‘known’ dishonest person? I wouldn’t.
Barack Obama anyone?
[…] As I noted in my earlier post the cover up to make AGW real meant CRU had to reduce the ‘1940’s blip” which is […]
[…] mine. As I noted in my second post, the smoothing process has created a statistical phantom. In that post I noted that much of the CRU […]
[…] This is just like when I asked how we get this: […]
[…] As I suspected when this story broke, the minor problem for the AGW alarmists was dealing with the Roman and Medieval Warm Periods. The big headache was the warm period prior to 1960, which we can see in the CRU data was equal to or higher than today. This warm period in the first half of the last century is a real problem for the theory of CO2 driven, man-made warming. […]
[…] How To Hide Global Cooling: Delete The “1940’s Blip†[…]
[…] House, and she didn’t mention it! If it’s not even on the radar of the press, there what are you talking about? Whaaa? Climategate whaa? Never heard of it. We plan on force-feeding green policies deeply […]
[…] House, and she didn’t mention it! If it’s not even on the radar of the press, there what are you talking about? Whaaa? Climategate whaa? Never heard of it. We plan on force-feeding green policies deeply […]
[…] email and these charts got me to wondering how bad the 1940’s blip was, which is why I went and looked at all the graphs and measured the pre-1960’s peak and […]
[…] This post was Twitted by merkmich […]
[…] How To Hide Global Cooling: Delete The “1940’s Blip†[…]
[…] http://strata-sphere.com/blog/index.php/archives/11466 How To Hide Global Cooling: Delete The “1940’s Blip” […]