Dec 03 2011
Climategate 2: Why The Divergence/Decline Destroyed The Hockey Stick
Updates At The End!
The Climategate 2 email drop is quite a daunting body of evidence. There is so much damning information it sometimes is hard to figure out what to post on and what emails to use to build a case of malfeasance.
My constant argument against the so called science underpinning the IPCC global warming claims is that it was pretty shoddy stuff. If someone attempted to use similar levels of mathematical techniques and data/software quality controls on any space program it would be borderline criminal. The so called scientists don’t even know what data is run behind any results! They throw out data that does not fit their theories and then claim to have discovered historic warming. And when this per-filtering does not work, they hide the bad data (known as hiding the decline or hiding the divergence).
To me the smoke and mirrors applied by the IPCC team to hide the severe problems behind their theories and results is the reason this entire area of science should be sent back to the quasi-science, backwater niche from whence it came. And for those not steeped in math or science let me explain why.
Humankind only has temperature records going back to about 1850. The farther back in time you go, the less accurate the record is due to a myriad of limitations:
- From 1850-1960 there is very little global coverage. Only a small fraction of the land mass has records that far back, and land only represents 30% of the surface of Earth. There is nothing ‘global’ in land based measurements from this period.
- Measurements are inconsistent and full of error. To get a daily temperature (high, low, median) you need to take regular measurements at the same time of day at each site, using the same measuring device. If you don’t repeat the measurement regularly you could miss the true high or low (as a front moves through). If you don’t do the measurement the same time of day you are cannot compare days (temps are not the same at 0700 and 0800 on any single day). Therefore the record from this period is not very precise.
- No continuous record really exists. This is because the temperature sensors was changed out from time to time, the procedures updated, the site moved and urbanization crept outward as humanity expanded and explored the world.
This means the only truly solid temperature record of MODEST consistency runs from 1960 to today. You could argue this tipping point may be 1950 or some other year, but the period of the cold war is when global sensing for military and aviation purposes really kicked in, as did electronic measurement systems, quality time keeping, etc. Since this time, precision in temperature at a regional level as only increased. Prior to it, it was a crap shoot.
Now, how do we know if the EARTH today is warmer, cooler or about the same (the Goldilocks test) than say the last 1500 years? The modern global record is only 50 or so years old. So how do we know now the world is experiencing unprecedented warming? Because if we aren’t experiencing unprecedented warming today, then the IPCC Chicken Littles cried “Wolf!” (or “Fire”) without good cause. That is THE crux of the AGW, CO2 driven alarmists case. Stop carbon-dioxide production from energy sources or we will perish because of runaway warming.The problem is they have to PROVE today is unprecedented, instead of another phase in a centuries long cycle that produces warm periods as have been seen in the Roman and Medieval times. So how did they do it and was it sound?
The scientist decided to use proxies to indirectly measure prior temperatures. A proxy is something we can measure today and then infer a past temperature. There are many proposed proxies being analyzed today, but the only way to prove a proxy does reflect local temperature is to show it follows the modern temperature record. This is how the IPCC scientists TRIED and FAILED to make their case.
The dominant proxy in all the IPCC alarmist science is tree rings (denoted as TR in many emails). Tree rings can be used in various ways, but the two dominant measurements in the IPCC science is tree ring width (TRW) and tree ring maximum latewood density (MXD). It turns out the MXD supposedly is more sensitive to temperature than TRW. But the fact is neither apparently is good enough.
So what happened when the IPCC scientist compare their prime proxies (TRW and MXD) to the modern temperature? The tree rings diverged from the thermometers. This is the big smoking gun behind Climategate 2. While the 1960-2011 temperatures rose to a peak in 1998 (and then went flat or cooled slightly since), the TR proxies in many areas showed a decline in temperature from 1960 on. CO2 was rising, temperatures were rising, but the TR data gave mixed signals and clear cooling in complete opposition to local temperature records.
Clearly this science is settled then. You cannot use TR data to infer past warming levels if you can’t use them to infer today’s!
So how did the IPCC scientists respond to this divergence, where tree rings shows a large temperature decline in complete opposition to what the thermometers were saying? They tried to cover it up and pretend it did not exist.
When they ran the tree ring only data, it showed modern cooling and the world not as warm as the Medieval and Roman warm periods. This has been shown many times and is not even challenged by the IPCC Scientists. They openly admit they truncated the tree ring data at the point it diverged, and then spliced in the thermometer data to pretend this was the result they got.
One of the more dogged skeptics, who knows statistics better than any of the alarmists, has exposed the true depth of this cover up [click to enlarge picture):
At the time, no one knew about “hide the decline”. Mann et al do not mention anything about deleting adverse data. The Briffa reconstruction labeled in the legend as “Briffa et al scaled 1856-1980?, giving no clue to readers of hide-the-decline. Let’s now look at a magnified version of this graphic, blown up so that we can see how they handled the Briffa (orange) reconstruction. As sharp-eyed CA readers FergalR and haroldw observed, if you squint closely, you can see that the Briffa reconstruction was chopped off before its end.
Indeed, they did not simply “hide the decline”, their “hide the decline” was worse than we thought. Mann et al did not merely delete data after 1960, they deleted data from 1940 on, You can see the last point of the Briffa reconstruction (located at ~1940) peeking from behind the spaghetti in the graphic below [click to enlarge):
![]()
The alarmist lied. They lied when they claimed the data showed unprecedented warming. They lied when they claimed the Briffa data was through 1980 or 1960. If they were going to be honest, their graph would have looked like this:
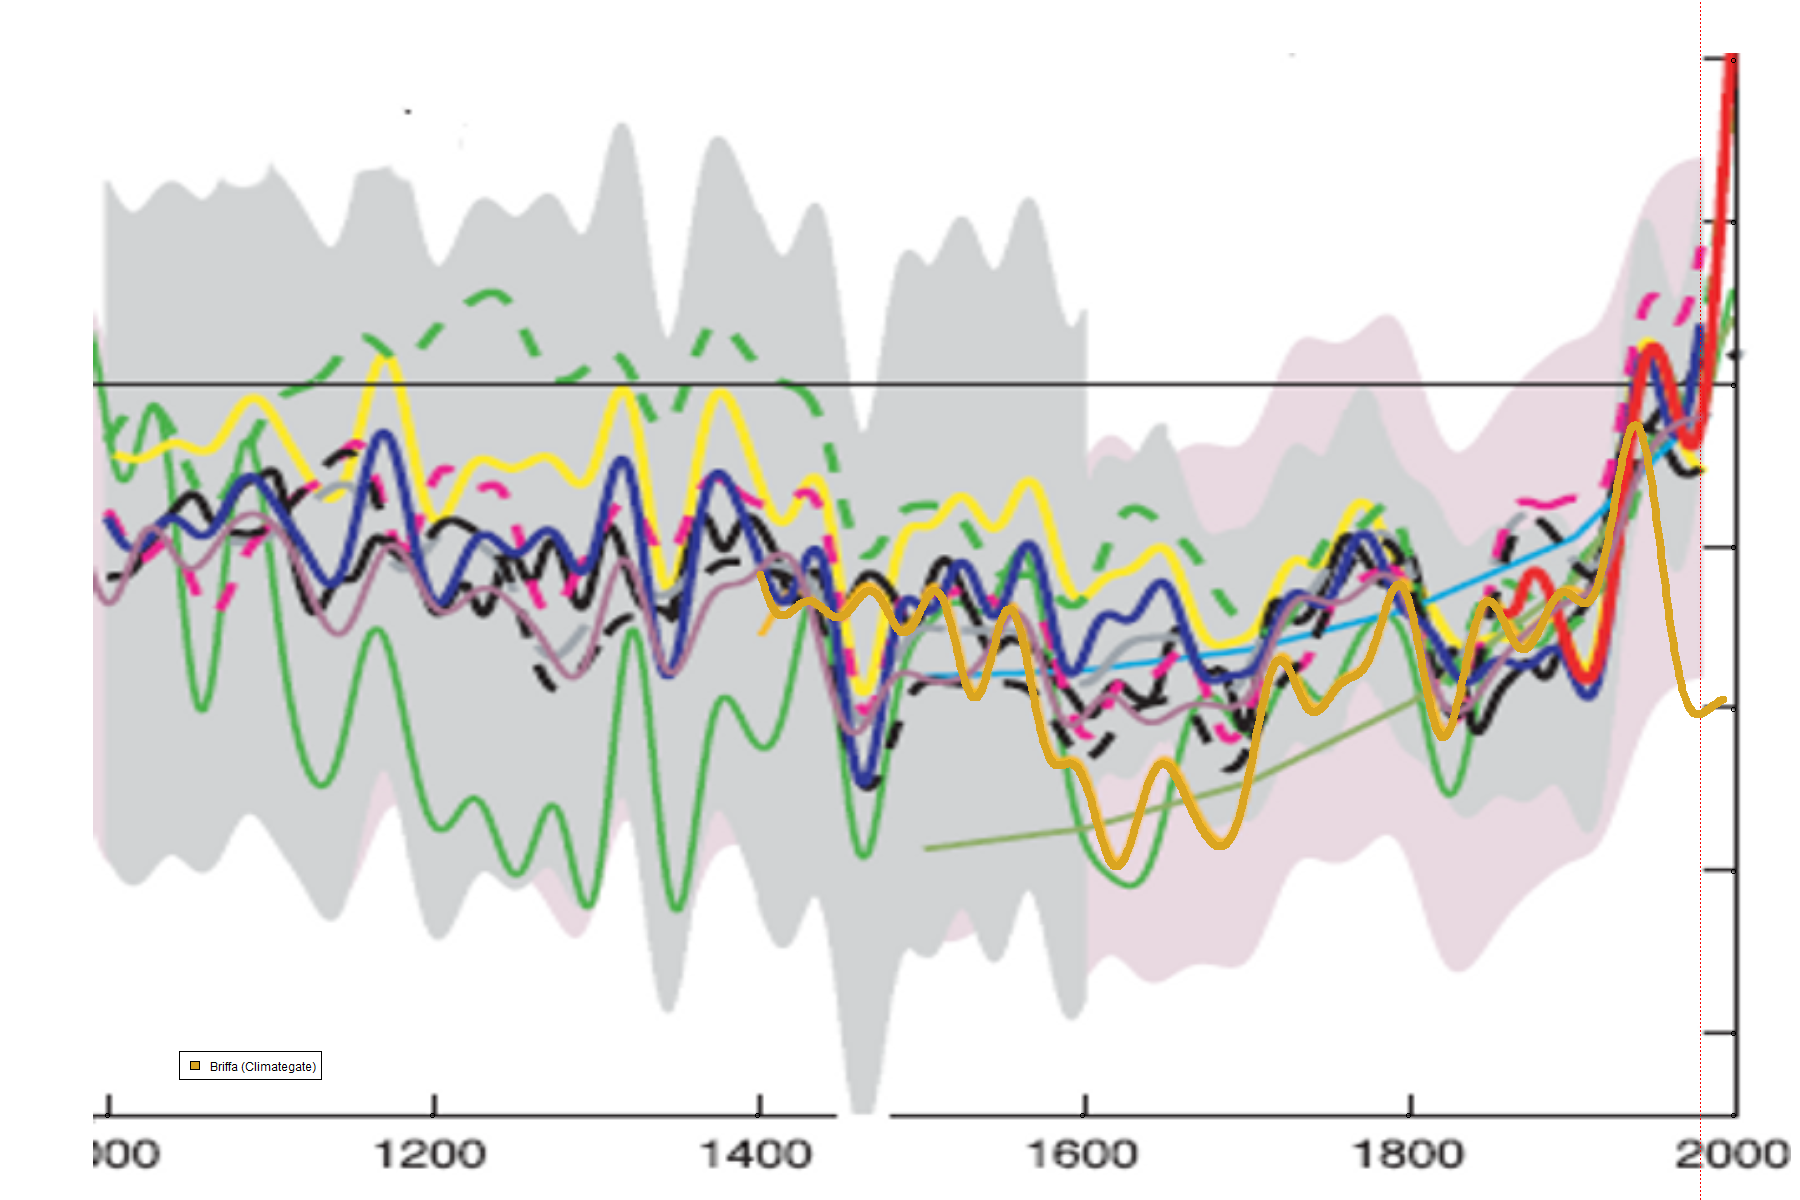
Note the yellow/orange line dropping way down at the end – that is the full data. The IPCC hockey stick has a false blade stuck on the end. It is a complete disinformation.This is a cover up of epic proportions.
I posted this critique about tree rings in a prior post, but the overall assessment of tree rings as global climate indicators is spot on and bears repeating:
A tree only grows on land. That excludes 70% of the earth covered by water. A tree does no grow on ice. A tree does not grow in a desert. A tree does not grow on grassland-savannahs. A tree does not grow in alpine areas. A tree does not grow in the tundra We are left with perhaps 15% of the planet upon which forests grow/grew. That does not make any studies from tree rings global, or even hemispheric.
The width and density of tree rings is dependent upon the following variables which cannot be reliably separated from each other. sunlight – if the sun varies, the ring will vary. But not at night of course.
cloudiness – more clouds, less sun, less ring.
pests/disease – a caterpillar or locust plague will reduce photosynthesis
access to sunlight – competition within a forest can disadvantage or advantage some trees.
moisture/rainfall – a key variable. Trees do not prosper in a droughteven if there’s a heat wave.
snow packing in spring around the base of the trees retards growth temperature – finally!
The tree ring is a composite of all these variables, not merely of temperature. Therefore on the 15% of the planet covered by trees, their rings do not and cannot accurately record temperature in isolation from the other environmental variables.
The proof that this was all lies is in the emails just released. Here we have numerous examples of the IPCC scientists openly discussing the divergence problem and their realization it was going to undermine the entire alarmists’ case.
Jeff Condon of Air Vent produced a tour de force post on how the climate scientists fell into this trap of seeing past temperatures in noisy tree ring data. It is a long and detailed post, but it hits the nail on the head. The most important ting to know is that tree ring data is first selected based on how it tracks with temperature. All those tree rings that don’t track are thrown out. This comes under the fancy name “detrending”, but is known to the layman as ‘cherry picking’:
Now that is quite a bombshell of an email. It is more serious than the ‘hide the decline’ situation because it gets to the heart of all of the paleo-hockeystick plots. If you consider that they are saying any change in temps greater than 100 years in length are a complete unknown, how is it that we “know” that recent years are the warmest in history? The very clear answer is – we don’t.
…
After all, just because we don’t really know historic temperature well, doesn’t necessarily mean we don’t know anything at all. The big problem for paleoscience is that it might mean exactly – We don’t know! What’s more is that any closer examination of the math of the typical papers proves out the worst of the science.
They actually have come to believe as a group that deleting data which doesn’t fit temperature and keeping data that does, results in a “true” temperature series. The problem is that there are internal and external inconsistencies in what is an obviously insane approach. Non-scientific critics of this blog have often written, “Why would you keep data which doesn’t show correlation to temperature?”. This situation is a common problem in science where data is not good. Normally you hypothesize that X is related to Y and then use stats to prove it does i.e. does cholesterol relate to heart disease. Imagine deleting the cholesterol data which didn’t agree!
In paleoclimate, the data is of such poor quality that the standard approach of using ALL of the data doesn’t work. At least it doesn’t show that there is a measurable response. Unfortunately, what has happened in paleocliamte has been a decades long process of selecting particular series by hand and over time sorting the non-similar data such that you can average all the noise to get a reasonably temperature-looking curve in recent years. This sorting though is an unscientific nightmare caused somewhat inadvertently by the sheer mass of the government funded science.
If you only select the data that proves your theory, of course your going to get the results you want. Jeff has numerous emails exposing this fiasco, but #3622 is a true bomb shell given the explanation comes straight from the alarmists themselves:
We decided, therefore, to make use of as many of the individual records used in almost all the previously published NH temperature reconstructions, excluding any records for which an indication of at least partial temperature sensitivity was lacking.
…
We excluded records that did not show a *positive* correlation with their local temperatures.
…
As stated above, we did not actually use strongly selective criteria, preferring to use those records that others had previously used and only eliminating those that were clearly lacking in temperature sensitivity.
This is just a small sample of what Jeff uncovered. These emails alone could form the basis for a real interesting congressional committee.
What really shocked the IPCC team is that even after this cherry picking, the divergence showed up anyway! They clung to the idea that there unrepresentative cherry sample was still reflective of the overall climate prior to 1960. In these emails the so called scientists cling to the pre-1960 thermometer data to claim one can infer sub-degree temperature differences over centuries from tree rings. Sadly for them, this argument is circular and wrong.
In email #2999 Keith Briffa attempts to claim the lack of correlation to the modern precise temperature record is not important since there is a connection to the much less precise older record – which defies even basic logic as arguments go:
… there is no reconstruction from these data after 1960 to show. The authors did not include this as their exploration of the tree-ring density data used clearly showed a low-frequency divergence between the chronologies being used and the regional summer temperature against which they were being compared. There were sufficient overlaps between the available pre-1960 data to demonstrate strong associations at high (inter-annual) and medium (decadal scale) timescales to provide support for the value of presenting the reconstruction based on these data.
… and the strong warming seen in the northern instrumental records between 1920 and 1940 is generally well matched even in the density data. It is for this reason that we suspect the divergence might be a problem only associated with recent decades. In such a situation it would be wrong to ignore this and calibrate using all the modern data – risking serious biasing of the calibration relationship used to infer past temperatures.
Briffa has his blinders firmly in place here. The most accurate temperature record is the one from 1960 to present, and it is here the tree rings fail miserably. Which means those associations with prior years are just ghosts created by the errors in both temperature records and tree ring temperature signal.
This was a well known problem inside the IPCC circles, as this 2005 email shows. It is email #0922 from Stefan Rahmstorf in Germany to Johnathan Overpeck:
– the main conclusion we draw is that recent warmth is unprecedented – if you want to see this, you must show the curves relative to the recent times
– it makes no sense if the proxy curves diverge strongly in the 20th Century, since this is only period where we really know what the climate was like.
This is the standard these people set for themselves by selecting their approach. You have to PROVE tree rings reflect temperatures and you have to succeed with the most precise period of the modern temperature record.
In email #3234 the point is hammered home by Richard Alley in 2006:
The NRC committee is looking at a number of issues, but the one that is most publicly noted is to determine whether, and with what confidence, we can say that recent temperatures have emerged from the band of natural variability over the last millennium or two. Millennial reconstructions with high time resolution are mostly tree-ring based, mostly northern hemisphere, and as I understand it, some are correlated to mean-annual temperatures and others to seasonal temperatures. The performance of the tree-ring paleothermometry is central. Taking the recent instrumental record and the tree-ring record and joining them yields a dramatic picture, with rather high confidence that recent times are anomalously warm [1]. Taking strictly the tree-ring record and omitting the instrumental record yields a less-dramatic picture and a lower confidence that the recent temperatures are anomalous [2].
Before I go further I want to note the what is being sad here in sentences [1] and [2]. Sentence [1] is the ‘hide the decline’ hockey stick where temperature data is spliced on the tree ring data to give the impression current temps are historically high. This is a huge lie, since it is supposedly the tree ring data that connects the past to the present (as shown by the charts above). Sentence [2] admits that when you remove the dodgy temp data and just use rings, then there is no historic recent warming.
Unless the “divergence problem” can be confidently ascribed to some cause that was not active a millennium ago, then the comparison between tree rings from a millennium ago and instrumental records from the last decades does not seem to be justified, and the confidence level in the anomalous nature of the recent warmth is lowered.
…
If some of the records, or some other records such as Rosanne’s new ones, show “divergence”, then I believe it casts doubt on the use of joined tree-ring/instrumental records, and I don’t believe that I have yet heard why this interpretation is wrong.
The fact is there are huge error/precision issues between the measurements, proxies and claims of the alarmists. One email that struck me as news worthy was Richard Alley’s initial impressions of how the IPCC fared in NRC hearings in the US in 2006. This is from email #3733 to the IPCC team:
I would also note that one of the committee members was asking each presenter whether the presenter believed that temperatures could be reconstructed for 1000 years ago within 0.5 C, and that the presenters were answering with some qualified version of “no”.
If the consensus answer is ‘no’, then there is no way to claim today’s warming is anywhere near historic. Alley summarizes the entire issue down to this:
These considerations do somewhat affect the confidence that can be attached to the best estimate of recent warmth versus that of a millennium ago. If the paleoclimatic data could be confidently be interpreted as paleotemperatures, then joining the paleoclimatic and instrumental records would be appropriate [1], and the recent warmth would clearly be anomalous over the last millennium and beyond. By demonstrating that some tree-ring series chosen for temperature sensitivity are not fully reflecting temperature changes, the divergence issue widens the error bars and so reduces confidence in the comparison between recent and earlier warmth [2].
Sentence [1] sets the criteria for the games Jones and Mann played with graphs to hide the decline would be mathematically legit. Sadly, the record shows the data and the team never met this criteria. Sentence [2] accurately provides the only option if [1] fails – the IPCC alarmists were wrong and we have no proof of historic (let alone runaway) warming. Surprisingly enough, the one and only Hockey Stick Mann himself agrees in email #0071, circa 2006:
I rebuked Cuffey for asking the wrong question. I pointed out to him that we certainly don’t know the GLOBAL mean temperature anomaly very well, and nobody has ever claimed we do (this is the question he asked everyone). There is very little information at all in the Southern Hemisphere on which to base any conclusion.
The truth is pretty clear now. There is no way to conclude with any semblance of minimal confidence that today’s climate is dramatically different from the Medieval and Roman periods. The tree ring data, which is the link between today and Earth’s past is proven to be incapable of such a comparative conclusion. It cannot reflect the modern temp record in the Northern Hemisphere and there is almost no data at all in Southern Hemisphere. And even if rings could track temps, they only measure a small fraction of the Earth’s surface (my guesstimate is the cherry picked tree rings at most represent 5% of the Earth’s surface).
The IPCC alarmists knew this for a decade – did everything they could to hide this disaster from the world. Fool me once, shame on you. Fool me twice, shame on me …
Ain’t going to happen twice.
Addendum: I had about 30 emails to distill down into this one long post, and realized there were a few I needed to add. The first is short, sweet and to the point. It is email #3986 and is one of the oldest in the cache, dating from March 2001. It proves how far back the ‘hide the decline’ went. It is from Scott Rutherford, Michael Mann’s presumed graduate student assistant, to Tim Osborne (at the time working for UAE):
>
>Is the reference period 1961-90?
>For the verification run the reference period is 1961-1990, but for
the 1400 reconstruction it’s 1900-1960 (mxd-temp divergenced problem
after 1960).-Scott
Pretty clear what happened here. For the long term reconstruction linking the past 1400 years (or going back to 1400, not clear) Mann’s shop truncated the data due to the MXD divergence problem after 1960. This is why Phil Jones referred as this kind of bait and switch “Mike’s Nature Trick”.
The second email I wanted to draw attention to is from July 29. 2009 and written by Keith Briffa. He is proposing a project to NERC to understand if the divergence is a real problem or not (seems a bit late to me!). Let me start with the end which is a summary of the project:
This project will seek to systematically reassess and quantify the evidence for divergence in many tree-ring data sets around the Northern Hemisphere. It will establish a much clearer understanding of the nature of the divergence phenomenon, characterising the spatial patterns and temporal evolution.
Clearly the science is not settled if this is a new project just being proposed 2.5 short years ago. What this email also does is a good job of explaining the background and why this project is necessary (to try and salvage the IPCC AGW theory):
Palaeoclimate reconstructions extend our knowledge of how climate varied in times before expansive networks of measuring instruments became available. These reconstructions are founded on an understanding of theoretical and statistically-derived associations acquired by comparing the parallel behaviour of palaeoclimate proxies and measurements of varying climate. Inferences about variations in past climate, based on this understanding, necessarily assume that the associations we observe now hold true throughout the period for which reconstructions are made. This is the essence of the uniformitarian principle.
I plan to return this foundational theory built upon the shaky assumptions contained in the uniformitarian principle. It is important to understand what this principle requires in order to apply it, and why tree ring constructions fail the tenants of this theory. For this I go to email #4454 dated March 2007 – arguments from on Hilary Stuart-Williams:
Uniformatarianism is exact. Not “nearly the same” but “the same”. If you could guarantee that the biochemistry and the genetics of the plant species were exactly the same, then I would agree. But you can’t assert that. Quartz sand IS exactly the same over time – no genetic variation.
…
I’m not sure that I agree with the use of uniformatarianism here. As a geologist (in a plant physiology group) I take it to mean that the same physical and chemical systems will react in the same way in the past as in the present. This is fine for sand bars and rivers, or even for speleothem isotopes, but I am not so sure about organic systems. You have to start by making the pure assumption that the systems are identical. We know that two wheats that look identical when growing, and certainly would look the same as fossils, have genetic differences causing variation in their stomatal response and water use efficiency. They are NOT the same and you cannot extrapolate the precise responses of one from the other.
I tend to agree very much here. 1400 years is a lot of time to assume THE SYSTEM is identical. In fact, given the range of global climate in any given year, and the multiple factors effecting rings, it is impossible to assume the uniformitarian principle for tree rings. Temperature is only one of numerous system (i.e., local climate and environmental) factors that are not going to be identical. So here again we find Briffa and the IPCC scientists establishing their claims on completely bogus grounds.
Back to Briffa:
In some northern areas of the world, recent observations of tree growth and measured temperature trends appear to have diverged in recent decades, the so called “divergence” phenomenon. There has been much speculation, and numerous theories proposed, to explain why the previous temperature sensitivity of tree growth in these areas is apparently breaking down. The existence of divergence casts doubt on the uniformitarian assumption that underpins a number of important tree-ring based (dendroclimatic) reconstructions.
If Briffa would take his blinders off (hard to do since it would negate his life’s work) he would realize that the divergence, and the need to select data that actually correlates to temperature records in the first place, are both evidence that this foundational assumption about the uniformitarian principle is wrong. I have a BS and biology and I can tell you this principle fails in all ecosystems every year. Some years there is drought, some years pestilence and disease, others fire could open up the canopy, or floods could provide a rush of nutrients to the roots. The day of the year these events happen can help a tree, or do nothing if it is dormant. MXD is notoriously only a summer time measurement – has nothing to do with winters or night.
By definition, this avenue of math and logic underpinning the IPCC science is completely and fatally flawed. And what does that mean? I’ll let Briffa answer that:
It suggests that the degree of warmth in certain periods in the past, particularly in medieval times, may be underestimated or at least subject to greater uncertainty than is currently accepted.
In other words, we were completely and totally wrong about our claims that today’s Earth is historically warmer than any other period in man’s past.


There are so many problems with the Mann et al paper that I can’t begin to count them all. The first problem is that, at best, tree rings are a proxy of only SUMMER temperatures while the tree is growing. They are not a proxy of ANNUAL temperatures. To show why this is significant, I will use the NOAA’s NCDC “Climate At A Glance” data set. From 1998 to 2010 summer temperatures in North America were flat with a trend of 0. Annual temperatures, however were down an amazing -0.98 F /decade. Almost all of this trend happened in winter where temperatures trended down at a “gobsmacking” -3.19 deg/decade. Winter temperatures in the continental US have been trending down at a rate of over 3 degrees per decade (and fairly linearly so) but tree ring data will NEVER see that because tree rings are a proxy for only SUMMER temperatures when the trees are growing.
That is the FIRST problem … trees can not provide a proxy for average ANNUAL temperatures, only for aggregate SUMMER growing conditions.
The second problem is RegM and two problems have been associated with that. The first problem and one which “The Cause” apparently duplicated according to the emails (4241.txt) is that even if you feed randomly generated time series into RegM you ALWAYS get the blade of the “hockey stick” at the end of the series. It doesn’t matter what data you feed it, it always generates a hockey stick.
So RegM produces the first part of the foundation for climate alarmism and that is that modern temperatures suddenly turned upwards in a hurry. The second piece, and the more fundamental in my opinion, is the notion that climate was stable until recently and was destabilized by human activity. That is the “handle” of the hockey stick. The long flat period where there is apparently little notice of the Medieval Warm Period or the Little Ice Age. The handle seems “flat” going back 1000 years. Well, it turns out that RegM creates THAT, too! A very important post at Jeff Id’s blog:
http://noconsensus.wordpress.com/2011/12/02/i-cant-hear-you/
Enter Bo Christiansen who writes a paper and even emails “The Cause” that RegM artificially flattens data with a slowly changing signal in very noisy data. The point here is that not only is the blade of the “hockey stick” wrong, so is the handle. The ENTIRE THING is BS. We have direct recorded evidence (not so much in temperature measurements but in other chronicles of the time) of extreme climate variability in the past greatly surpassing that shown in the handle of the “hockey stick”. For example, see this recent posting on Judith Curry’s blog of a paper by Tony Brown:
http://judithcurry.com/2011/12/01/the-long-slow-thaw/
And even THEN, we see from another posting on Dr. Curry’s blog that temperatures have NOT followed the gradual, almost linear change in CO2 but in recent times there have been three very distinct “step” changes that happened during large El Nino events. Global temperatures stepped up in those El Nino years and stayed flat after until they stepped up again in the next one. There is no correlation between atmospheric CO2 increase and temperature rise. Furthermore, the “warmanistas” would tell us that the amount of warming due to CO2 is strangely the same amount as the warming that has taken place since the end of the LIA. In other words, nature warmed the planet into the MWP, nature cooled the planet into the LIA, but only HUMANS warmed it up out of the LIA. Not only that, but half of the warming out of the LIA happened before the 1930’s before we were emitting much CO2. So our CO2 emissions today have to somehow travel back into time and raise the temperatures in the mid-late 1800’s to the early 1900’s.
It is absolutely bull!
Well said CP. I have never seen so much crap passed off as premier science in my life.
[…] second article is at the strata-sphere site and it features some of what I’ve written as well as a considerable amount of additional […]
[…] The IPCC is not using this data it turns out. The modern (and most accurate) global temperature record (1960 to present) diverges from the primary temperature proxies used to assess current temps against historic temps (i.e., tree rings). Tree rings show “a decline” in temperature in many parts of the Northern Hemisphere in the last 50 years.. Therefore we do not see in the Hockey Stick calibrated tree ring temperature signals from the last 50 years compared to previous ages like the Medieval and Roman Warming periods. […]
Do you have a link to email 3622? Google isn’t finding it.
For your “Briffa Bodge” post, the link to that email is
http://atlantisls.net/climategate2/FOIA/mail/3468.txt
Very good post(s). Very bad science.
—
“The alien device was a blank, black cube about a foot high and three feet long.” (Philip E.High, “Twin Planets”, 1967)
[…] man-made CO2 driven global warming. From the exposure of the ‘hide the decline’ trick which destroys the hockey stick graph, to the realization that the unaltered, clearly represented data and results from the CRU […]