Dec 15 2009
Hide The Lag! AGW Theory Destroyed By Ice Core Record
The fraudulent representation of scientific data is going to be the death knell of AGW and what is written on the headstone.
Here Lies The Scientific Method
Assassinated By Global Warming Fanatics
Too many of us who should know better and could have seen the problems with AGW theories earlier left it to the scientific community (awash in government and corporate funds) to do the ‘right thing’. Boy, were we wrong.
Joanne Nova has another damning example of how graphs have been used to misinform the public, and it has to do with the relationship of CO2 to warming – the heart of the theory behind global warming and all these schemes to tax the world into economic oblivion:
Here is the first chart shown by Al Gore (used car salesman extraordinaire) relating CO2 to Temp.
AJStra
Looks pretty damning. Looks like CO2 and Temp are in lock step. Too bad too few people take the time to look at and digest the x and y axis and what it means. This represents almost half a million years. Its like watching a movie at ultra fast forward.
Now here is a blow up of that chart to show the timing of the two curves on a more reasonable time scale, covering only 50,000 years or one tenth span of the previous chart:
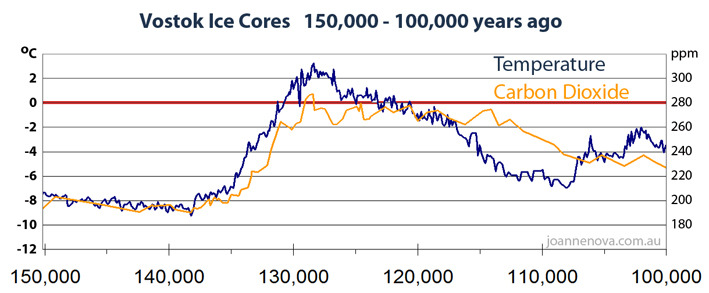
Now we see things that are very elemental to the theory of man-made warming. Things that destroy the theory completely. We can now see an 800 year lag in the CO2 response to warming temperatures. Not driving temperature, responding to temperature. This is why time was sped up in the chart above – to hide the lag!
Ice cores are great proxies because the link between temperature, CO2 and the make up of the ice is driven by chemistry. It is a physical process with little and consistent ambiguity. Unlike tree proxies (living organisms) which have many conflicting factors effecting growth and very few samples which make the connection hazy at best. The chemistry makes the historical record crystal clear (pun intended).
What is a crime of deception is hiding all this stable and clear evidence inside a time compressed graph. When we uncover the ‘trick’, we find more evidence AGW is a failed theory. And we find more misinformation. Science as ‘tricks’ instead of ‘truth’. Thus ends the respectable field of science.


[…] This post was mentioned on Twitter by ThunderPig, AJ Strata. AJ Strata said: new: Hide The Lag! AGW Theory Destroyed By Ice Core Record http://strata-sphere.com/blog/index.php/archives/11896 […]
Ok, ever have a lake nearby that when it warms up in summer the fish die? It happens at Lake Elsinore, California every so often. Why? Because warmer water holds less dissolved gasses. If it gets warm enough it won’t hold enough oxygen but that also holds true for CO2. As you warm the water up it releases its dissolved gasses to the air. Notice how soda is MUCH more fizzy when warm than when it is cold. As the ocean warms up it begins to release the CO2 it was holding when it was cold. Volcanic activity under water is constantly injecting pure CO2 into the ocean. When the ocean warms up, it can hold less of it and releases it to the air.
It takes the ocean a LONG time to warm up after the air temperatures warm. Water holds a lot more heat than air does by volume. So it might take several hundred years for the deep oceans (where many of the volcanic vents and mid-ocean ridges are) to warm even a single degree. In fact, the deep oceans are probably still in the process of recovering from the “Little Ice Age”.
We don’t know for sure because we can’t measure temperature that deep. Transoceanic cables might be a good candidate to have external temperature sensors mounted on them to record sea temperatures on the abyssal plains.
Deep sea temperature recording would give a better idea of climate because one could see any variation quite clearly with no need for adjustment and there would be no diurnal (day/night) variation. If the temperature of the water generally across the abyssal plains increased a half degree in a century, that would be a good indication that climate has changed in general.
But it should be noted that the Arctic ice cap probably keeps temperatures from rising much. Deep water temps would probably not rise dramatically unless the Arctic were to go ice-free which probably hasn’t happened in the last 2000 years (but probably did happen in the last interglacial which was warmer than this one has been).
AJ;
Enjoy your articles about AGW and how the media and UN are all trying to “spread the wealth” around with “tricked” data. You explain the facts in very good detail that the average layman can still understand (very good scientific facts and links).
I’ve always started with one statment for many years when someone talks about global warming, “how were the Vikings able to farm on Greenland and now it is mostly covered in ice”?. When they can’t explain it, they walk away. History is history and you can’t rewrite it (at least for now).
Anyway, here are some sites and articles that might help the average reading understand a little more about the effect of water vapor, solar flares, tilt of the earth, etc. (articles are back about 5 to 8 years).
http://www.geocraft.com/WVFossils/greenhouse_data.html
http://www.marshall.org/article.php?id=91
http://www.geocraft.com/WVFossils/ice_ages.html
Thanks Bob! Always could use more good references.
And that’s not to mention the rest of the body of scientific evidence that does not support the theory of C02 driven AGW.
Things like tree growth (coverage/areas..not rings) , insects, fossils, etc., flora, that are temp/environ sensitive..all form a picture of warming, or cooling over time, that does not jive with the theory of AGW. Least they think the “deniers” planted trees under the ice that clearly show past eras of warming that their chart manipulations have successfully erased from their data lines.
But, that cannot erase the rest of this historical record. Insects that follow heating and cooling trends. Plants/vegetation, and other artifacts from humans prior to the industrial age, tree growth that all show significant warming (and cooling) along the way. The important part here being…their timelines/theory…doesn’t jive with the historical/scientific/geological record of time on many different fronts. There is LOTS of evidence out there, that contradicts AGW theory and their “adjustments” that they have made to the historical temp records.
translated from original german
http://wattsupwiththat.com/2009/11/29/the-medieval-warm-period-a-global-phenonmena-unprecedented-warming-or-unprecedented-data-manipulation/
This was also pointed out in the movie “The great global warming swindle”. This got 5/5 stars from me (I have the early version before Wunsch was removed).
http://www.greatglobalwarmingswindle.co.uk/
I got here from Briggs’ website and have enjoyed a few of your posts tonight. I really liked the rocket science link that brought me here from Briggs. Time to get some real work done.
Thanks for the effort you make in trying to keep these guys honest.
[…] reason this is overly compressed can be found here (where we uncompress the timeline and discover very important details the man-made warming alarmist […]
[…] including the use of tree rings to overwrite the much more accurate ice core data. There is also the trick of collapsing time so that people don’t see the fact CO2 changes have lagged temperature changes by 800 years, […]
[…] see this again in the ice core record going back thousands of years (as I noted in this post). Over time the atmospheric CO2 response has typically lagged temperature increases, sometimes by […]
[…] in the business of creating images of global warming (by hiding tree-ring declines and hiding details in ice cores) instead of doing real […]
[…] it could not trigger warming. Ice cores show how green house gas production lags temperature increases (click to […]