Oct 05 2009
Global Warming: The Forest For The Tree Rings
Updates Below
There has been a shocking discovery in the last week as it pertains to global warming: there may be nothing unusual about the recent warming of the Planet Earth.
This realization has come about because it was discovered that suspect tree ring data used to relate today’s climate to historic trends has been shown to be … let’s say ‘unique’. As noted here, here, here and here it turns out that only a very select set of data from a remote Russian peninsula has any indication of massive tree growth in recent years. In fact it comes down to one magic larch, whose massive growth probably is NOT related to warming, let alone increases in man-made CO2.
The scientists who had created the supposed warming trend in their data and graphs actually had in hand much broader set of tree growth data from across that region of Russia. Due to the data’s larger size is not susceptible to one individual tree’s growth, or any other local environmental conditions that may have provided more abundance for above average growth. This larger data set has an intriguing feature – it shows no unusual growth, therefore no unusual global warming. Here is how the key events were summarized by one source:
Briffa had published a paper in 1995 claiming that the medieval period actually contained the coldest year of the millennium. But this claim depended on just three tree ring records (called cores) from the Polar Urals. Later, a colleague of his named F. H. Schweingruber produced a much larger sample from the Polar Urals, but it told a very different story: The medieval era was actually quite warm and the late 20th century was unexceptional. Briffa and Schweingruber never published those data, instead they dropped the Polar Urals altogether from their climate reconstruction papers.
Briffa went on to produce the Yamal series, which had the same strange result of exceptional warming based on one tree’s unique growth. With all the data in his hands, only that which showed unusual recent warming slipped out to the public.
Strange, how a broad set of data – which is optimal for detecting a global condition outside individual or local area conditions – showed no runaway warming and yet remains unpublished. All the while a small set of 10-15 trees with one outlier (probably thriving due to the fact an older tree fell and gave it room to grow) is pawned off on the world as an indication of runaway, planet-wide warming.
Worse, the data that proved this situation was kept hidden from the public for nearly a decade (which violates the very basis of science and the scientific method).
So now we have data which scientifically challenges the ‘settled’ conclusion of global warming. And that data has been in the possession of the global warming alarmists for more than a decade.
But let’s not loose sight of the fact that these hand picked tree ring cores are not the only data we have on hand for analysis. One of the strangest contradictions in the solar system is that no one has explained why Mars, Jupiter and other planets of our solar system have also recently experienced global warming! How is it they too experienced warming, without the man-made CO2 to drive their systems.
The following video clip is of three pictures of the Martian Ice Cap taken by the Hubble Space Telescope in October of 1996, January of 1997 and March of 1997 – right before the peak warm year of 1998 here on Earth:
Note how much of the Martian Ice Cap disappeared at the same time man-made CO2 was supposedly heating up our own Earth. Coincidence? Between the tree ring data showing no unusual warming and the Martian Ice Cap retreating it is clear that whatever is happening on Earth and Mars, it is not man-made.
By the way, it is not surprising the Martian Ice Caps would respond much more dramatically to any solar system wide phenomena than Earth’s would. The planet is colder, its atmosphere is thinner, and it doesn’t have the oceans and green house gases to moderate solar system wide changes. Our green house gases are what keeps Planet Earth habitable. They protect us from solar variations. Our massive seas provide us regular rain and snow, etc. Our system is self regulating to a much broader range of conditions than Mars.
There is no doubt Mars is going through a cycle of global warming, that planet has an armada of spacecraft and landers investigating the planet and we keep a close eye on it:
The planet Mars is undergoing significant global warming, new data from the National Aeronautics and Space Administration (NASA) show, lending support to many climatologists’ claims that the Earth’s modest warming during the past century is due primarily to a recent upsurge in solar energy.
…
According to a September 20 NASA news release, “for three Mars summers in a row, deposits of frozen carbon dioxide near Mars’ south pole have shrunk from the previous year’s size, suggesting a climate change in progress.” Because a Martian year is approximately twice as long as an Earth year, the shrinking of the Martian polar ice cap has been ongoing for at least six Earth years.
This report is from 2005. I guess it is possible (though unlikely) for Mars to experience something coincidental to the Earth, but yet be independently driven. But when you see the same warming signature on other planetary bodies, then you cannot ignore the conclusion that the Sun is inducing ‘climate change’ on the entire solar system.
From MIT on Pluto
“the average surface temperature of the nitrogen ice on Pluto has increased slightly less than 2 degrees Celsius over the past 14 years.â€
…
From MIT on Triton:
“At least since 1989, Triton has been undergoing a period of global warming. Percentage-wise, it’s a very large increase,†said Elliot, professor of Earth, Atmospheric and Planetary Sciences and director of the Wallace Astrophysical Observatory. The 5 percent increase on the absolute temperature scale from about minus-392 degrees Fahrenheit to about minus-389 degrees Fahrenheit would be like the Earth experiencing a jump of about 22 degrees Fahrenheit.â€
Mars, Pluto, Jupiter’s moon Triton and Earth – all showing signs of climate change? Has the entire global warming canard been a case of not seeing the forest for the tree rings (of one tree)?
Apparently so, because for the last decade the Earth has not warmed, even though CO2 levels keep climbing. There is plenty of data from Earth that proves the UNIPCC with their busted models and exaggerated predictions are wrong. Way wrong:
Thus, despite some completely misleading headlines from some of the climate-fear propaganda media to the contrary, this summer, Arctic Sea Ice Extent is significantly increasing with large growth of new, thick, sea ice.
…
Cryosphere Today data reports that the sea-ice growth at both poles shows the worldwide, global sea-ice extent is within just a few percent of the long-term, 1979-2000 average. This growth clearly does not support the global-warming-alarmist claims that massive sea-ice declines are caused by man-made CO2 emissions.
This extremely low number of hurricanes during the summer period has not occurred since 1994. Alarmist claims of more and stronger hurricanes in our future is not supported by the 15-year, record-low hurricane rate during what is historically the most active portion of the hurricane season.
The list is endless, to be honest. In 1991 the UNIPCC made some dramatic predictions based on their ‘science’, and not one of them have come true. Let’s focus on two big myths that remain alive today: temperature and sea level. Here are the 1991 UNIPCC predictions
Based on current models, we predict: under [BAU] increase of global mean temperature during the [21st] century of about 0.3 oC per decade (with an uncertainty range of 0.2 to 0.5 oC per decade); this is greater than that seen over the past 10,000 years; under other … scenarios which assume progressively increasing levels of controls, rates of increase in global mean temperature of about 0.2 oC [to] about 0.1 oC per decade.
…
Under the the IPCC business as usual emissions scenario, an average rate of global mean sea level rise of about 6 cm per decade over the next century (with an uncertainty range of 3 – 10cm per decade), mainly due to thermal expansion of the oceans and the melting of some land ice. The predicted rise is about 20cm … by 2030, and 65 cm by the end of the next century.
Since 1991 the Earth’s temperature has not risen 0.6°C as they claimed it would. It did not rise 0.4 – 1.0 °C , or the range the UNIPCC predicted. At most it has moved up 0.2°C, which is well within the error bars of any global temperature measurement. Therefore, the UNIPCC’s ‘science’ has been proven to be flawed by the actual temperature record..
And if we look at sea levels we don’t find an increase of 12 cm, as the alarmists claimed would happen, we see this:
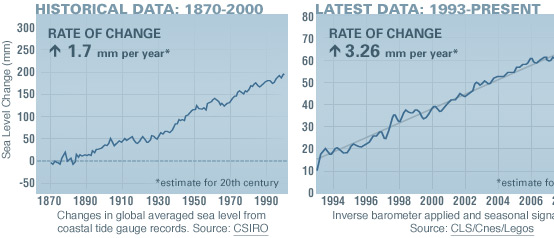
A change of 3 cm per decade, at the very bottom end of the UNIPCC’s range of possible outcomes under their doom and gloom scenarios – which means (conversely) this value is on the upper boundary of ‘normal’ as well. Also note the caveat ‘estimate’ on this data.
There has been no proof that these space based systems can actually measure a global value to this precision. They think they might be able to, but the Earth’s oceans are not flat and consistent. Â Between wind, waves running 10-100 feet, bulges over mid ocean ridges, heat expansion/contraction and tides ranging many feet, it is hard to say where the mythical ‘normal’ is for the world’s oceans.
Finally, if that was not enough to completely destroy the global warming, man-made CO2 canard, a Japanese spacecraft was recently launched to measure where the man-made CO2 generation was the highest. Of course the myth goes that Americans are the worst producers of CO2 (a needed natural chemical compound). The results were probably a huge shock to the alarmists:

GOSAT Worldwide Methane – Methane (column averaged dry air mole fraction) initial analysis (April 20-28 observation data)- click for larger image Source: JAXA

GOSAT Worldwide CO2 – Carbon dioxide (column averaged dry air mole fraction) initial analysis (April 20-28 observation data) – click for larger image Source: JAXA
For a complete description of how GOSAT works, please read their summary here (PDF)
It turns out America is a CO2 sink (lower chart), as are all the Americas. We have left a significant portion of our country green. The Americas are a CO2 sink becasue this green absorbs CO2 as the air moved West to East (in the Northern Hemisphere).
America is not the largest producer of CO2 or Green House gases, by far. That honor goes to North Africa, Europe and Asia (especially China). There is nothing the US can do on its own to reduce global CO2.
But as all the information here shows, why would we worry about CO2 anyway? It could not have produced the global climate change we have seen in the solar system. Moreover, the full tree ring record shows no unusual warming in the last century, let alone CO2 driven warming.
And given the fact that the alarmists predictions have never come true, and our climate remains inside the ‘normal’ range, why would we reduce CO2 production through oppressive taxes, crippling economies around the world and throwing humanity into the dark ages?
Sounds to me like the UNIPCC believes in bleeding the Earth to reduce a phantom global fever. That is Medieval thinking! And they call skeptics unscientific.
Update: Massive global warming discovered in Antarctica – about 15.7 million years ago.
Update: More hard data that global temperatures have been dropping for at least 8 years, and the oceans have been cooling for 6 years. Let’s all declare victory  and return to sanity – shall we?


Not trying to be “nit picky”,
“Since 1991 the Earth’s temperature has not risen 0.6°C as they claimed it would. It did not rise 0.4 – 1.0 °C , or the range the UNIPCC predicted. At most it has moved up 2°C, which is well within the error bars of any global temperature measurement. Therefore, the UNIPCC’s ’science’ has been proven to be flawed by the actual temperature record..”
Should the 2 C degrees be .2 Cdegrees?
Rick
Rick C,
Catching typos is not being nit picky – thanks!
[…] This post was mentioned on Twitter by cathymv. cathymv said: OMG! The sky is NOT falling: http://bit.ly/u4QyN […]
From the icecap article:
“Even a strong El Nino – expected in the coming months – will be unlikely to reverse the cooling trend.”
I believe that El Nino has already fizzled or will linger on as a very weak one. I am still waiting for NCDC to update a database with September numbers and will let you know what the cooling trend for North America is. As of August the past 10 years have cooled at a rate of 0.9F per decade or 9 degrees per century. That would put us in nearly iceage conditions if it kept up for another 20 years at that rate.
[…] … for serious comment, see this. Social activism against scholarship will ultimately […]
[…] Global Warming: The Forest For The Tree Rings […]