Oct 24 2010
Early Voting Trends Show Broad Edge in GOP Enthusiasm
I wanted to really ascertain which party was more motivated to vote (or more successful in the GOTV) using a common measurement that avoids turnout model speculation. In my mind, if a party is outperforming its 2010 registered-voter percentage, then it is has to be enjoying a edge in voter enthusiasm. Even more importantly, if partisans are supposedly ‘coming home’ to their party (voting 95% party line), then it is important to see who has the edge in actual voters voting, and how the GOP leaning independents can stack up in these battles. This post looks at 2010 registered voters verses 2010 early voters, and draws some interesting conclusions.
From this site we find the latest and greatest early voting tallies. What I am looking for are partisan tallies, which are provided in only a few states. I selected 7 states with partisan numbers I could locate here (or elsewhere) and began to look at the percentage of the vote to date by party, compared to the percentage of registered voters by party. All registered voter numbers are for 2010.
In 6 out of the 7 states the GOP has a clear advantage in exceeding their registration levels in actual voters voting. Also fairly common in the results is the fact GOP and Dem GOTV efforts tend to reduce the percentage of voters coming from the independents or smaller parties. However, when you add the GOP and “Other” affiliation numbers you quickly see how GOP leaning independents can move toss up states into GOP tilting ones. I have developed a simple test to measure how combined GOP and “other” voters can impact the overall vote tallies.
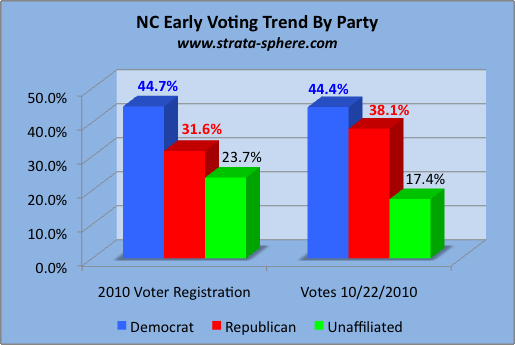
So let’s begin in no particular order (except I leave the lone state with a dem lead for last). First up is North Carolina, because I think it has one of the best election tracking sites out there. It does not appear to be state run site, but it sure is the best model for all future election sites. Here is the graph we produced comparing the vote through 10/22/10 with the NC registered voter statistics (click all graphs to enlarge):
In NC we clearly see the Dems coming out right in line with their voter registration percentage (~44%). The GOP, on the other hand, is showing a +7% lead over their registration percentage. I can read this no other way but to see GOP voters more energized than the Democrats – remember, this is not ‘likely voters‘ we see in polls but voters voting. Since these are not votes we have no way of knowing what the actual vote total is right now, we just know the GOP is out performing their registered voter levels.
But we can develop a simple test case to see a theoretical result based on partisan ‘voters coming home’. if we assume the Dems and GOP both take 95% of their voters votes, and the GOP takes a 60-40 lead with independents, the Dems would win the numbers game in NC with 51.1%. But if they lose 4% of their base, then the GOP wins – which is why you can only read so much into these numbers. From here on I refer to this calculation as the 60-40/95 test on the early voting tallies. It shows the impact of the Dems being outperformed by the GOP, assuming the typical +20% lead they enjoy with independents in all national polls out over the last month or so.
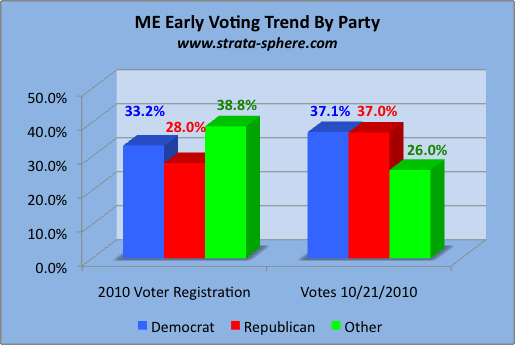
So next we move to Maine, where we see another similar result when we look at votes cast verses ME voter registration by party:
Here the Dems are 4% above their registered voter levels, but the GOP is 9%, and that makes a huge difference. Also in ME, there is a large group of ‘others’ registered. Unlike NC, where a 60-40/95 allowed the Dems to eek out a 51.1% lead, here in ME the GOP would win by 53.7%. The reason is the GOP + independent number is now a greater proportion of the voters – the Dems have dropped to 37.1%. We begin to sense a tipping point for Dems.
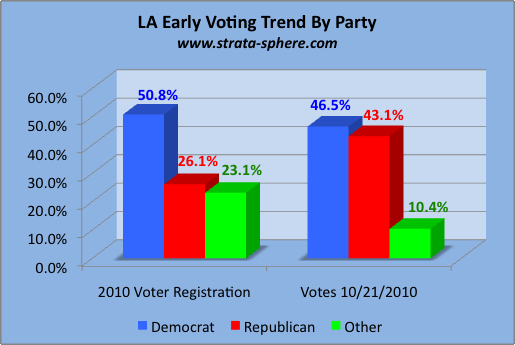
Next up we go to Louisiana, a state that has a high number of registered democrats, but a clear enthusiasm gap tilted towards the GOP:
The Dems start with a monstrous 51% registered voter lead, but what we see in the actual voting is Dems performing well below this mark (-7.7%), while the GOP is just rocking with a +17% above their registered voter levels. When we do the 60-40/95 calculation in LA early voting the GOP gets a razor thin 50.9% lead. Which tells me there are a lot of Democrat defections considering where David Vitter Blanche Lincoln is heading for November 2nd (i.e., new 6 year term in office forced retirement).
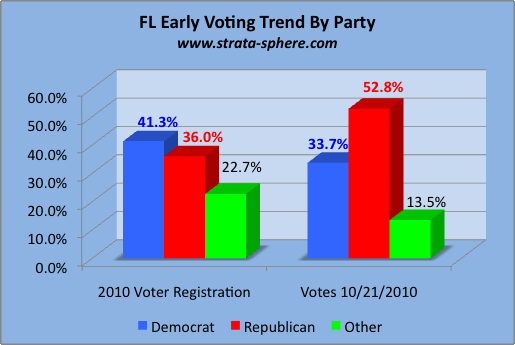
Moving on we head to sunny Florida, a disaster in the making for democrats, considering their share of the FL registered voter rolls for 2010:
Talk about a blow out. Dems are performing -7.7% below their registration level while the GOP has an enthusiasm force of +16.8% – very much like LA. But in FL the Dems start off with a much lower registration edge, and that makes all the difference. The 60-40/95 calculation gives the GOP smashing 61% of theoretical votes. I would not want to be a dem running in FL this year.
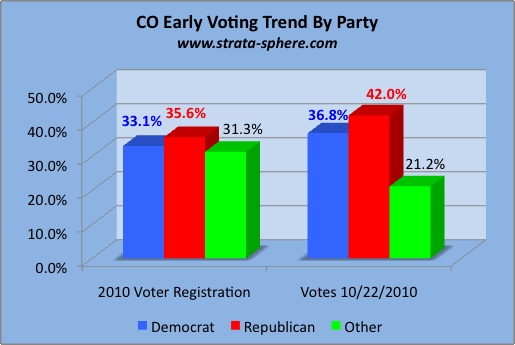
Moving on we head to Colorado, which has an incredible balance between the GOP, Democrats and ‘Other’ affiliations in the 2010 Colorado voter registration numbers.
All three groups of voters start with around the same strength in registered voters. The Dems actually kick up their early voter numbers by 4%, but the GOP again shows a large enthusiasm gap in Colorado with a +7%. Again we see the Dems under 40% of the total, which means the 60-40/95 test gives the GOP a 55.6% lead in theoretical votes. I seriously doubt Senator Bennett will be returning to DC after November.
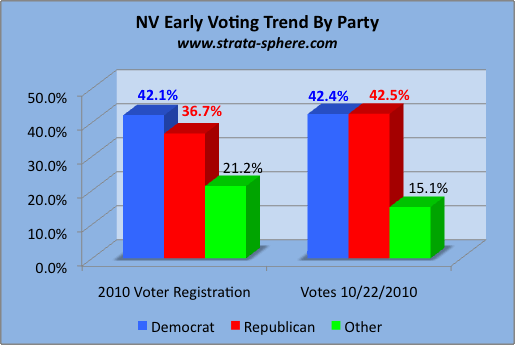
Our last stop across the nation is in Nevada, where Senate Majority Harry Reid is struggling to hold on. Nevada Voter registration also shows a significant edge for Democrats in terms of registered voters:
In terms of actually voting it is the GOP voters who are highly motivated. Democrats are coming out in line with their registered voter level, but GOP voters are running +6%. It is clear the enthusiasm gap exists in NV, and using the 60-40/95 theoretical vote test this would lead to a GOP win of 52.8%. Harry Reid does not look like he will survive the voter backlash tsunami.
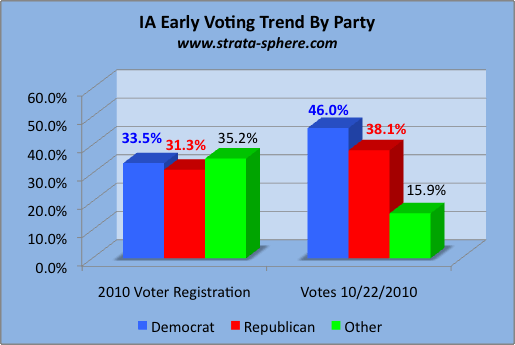
Now for the surprising outlier, and this is Iowa. Iowa, like Colorado, begins with basic parity in their registered voter mix, but for some reason Dems are very excited to vote in Iowa (compared to all other corners of the nation we have looked at):
The GOP is up 7%, but the Dems are up 13%. What could explain this? My gut feeling is Iowa still has a lot of center-left or blue dog democrats. They are probably the last large pool of Reagan democrats. My guess is (since there are no polls showing GOP troubles in Iowa) this is not an indication of Democrat enthusiasm as much as Democrat defection.
So what is it we can learn from this data? First of all, if the Dems can get to 44% in the overall voting then the 60-40/95 test indicates they may eek out a win (the NC example). Fall to 42% with GOP equally as represented (the NV case) and the Dems lose. As long as the GOP is more enthused to vote, the 60-40/95 test indicates they will win. This assumes the independent gap (+20% GOP) combines with the enthusiasm gap to neutralize DEM GOTV efforts and party line voting. Lots of Democrat defections from left of center and November 2010 will be one for the century.
I did not assess WV or MD (heavy democrat states in terms of registered voters) since I would expect to see what we see in Iowa and North Coralina – large numbers of registered Democrats voting. But we know many of those are defecting in WV and staying with the party in MD.
Bottom line: there is a GOP enthusiasm gap showing up across this country, From Maine to Florida, to North Caroline and out to Nevada and Colorado. Any suggestion of a Democrat resurgence in polls is just statistical myths due to turn out model games. When you compare registered voters to actual voters, the case is closed.
I will be updating these later in the week to see how things are trending closer to the big day of voting.
Update: Some timely reading about the impact of turn out models (polls) and turn out data (early voting).
From Sean Trende at RCP, then Jay Cost at Weekly Standard, with Jim Geraghty’s ‘Obi-Wan Kenobi’ putting it all in context.
Update: Politico weighs in as well – sees GOP energy.


I spotted an error in the Louisiana segment. Blanche Lincoln is running in Arkansas not Louisiana that was stated in the segment
Great post. Blanche Lincoln, however, is from Arkansas not Louisiana…
Wow – stan25 beat me to it ….
AJ I think you nailed IA I am in IA and we have a very popular 4 term former governor running against the incumbant one term Dem governor who is not so popular after spending and taxing the State into a hole. The economy is not too bad but we are feeling the early effects of Obamacare with mass insurance company layoffs and price increases driving home the failure that Obamacare is.
the traditional teacher unions and other unions will stay largely Dem but behind the curtains of the polling booth many other Dems will vote R. Our governor, our Republican Senator Grassley, Congressman Steve King are in no trouble, only the Dem Boswell from a dem stronghold (Des Moines) is feeling the heat.
[…] This post was mentioned on Twitter by No Moonbeam, Chattertrap. Chattertrap said: Early Voting Trends Show Broad Edge in GOP Enthusiasm http://chtr.it/JsAJG8 #CAGov #California #election […]
Archtop – details, details! Thanks for the correction
[…] ties in nicely with one of the updates I have waiting on the early voting analysis I presented this morning. At the above mentioned Politico link we find data on the PA early voter partisan mix and how this […]
[…] early voting trends – comparing early voter turnout to registered voter levels in 9 states (previous version here). I added the voter registration levels for 2006 and 2008 to the charts since they were graciously […]
Jon Stewart and Stephen Colbert’s Rally knockoffs
to Restore Sanity and/or Fear airs live Saturday on Comedy Central, but that hasn’t stopped thousands of die-hard fans from jumping on planes, trains, buses, and even bicycles to get to Washington’s National Mall. They hail from as far away as San Diego; Lansing Mich.; and Worcester, Mass. And it’s not just the progressive faithful or college kids. Boomers, Gen X-ers, Libertarians, and Republicans all are laying out cash and spending time to show up in person on Saturday. Fresh off a red-eye flight from the West Coast, high school teacher Suzie Knapp says this trip was something she had to do, because “it knockoff handbags
gets pretty lonely for Democrats in San Diego sometimes.” She contends, “It’s a pretty conservative place,” adding that she is looking forward “to the camaraderie at the rally.” IN PICTURES: Who will be at the Rally to Restore Sanity?
Ms. Knapp’s D.C. contact, Michael Tacelosky, Armani replica
lives in Dupont Circle, a 10-minute bicycle ride from the rally site. He says he hopes the rally will inspire people. “It’s all about the idea that gridlock is not acceptable, and that’s critical right now,” he says. Some taking the Greyhound option are preparing for a long night in a bus seat before they spend mere hours on the National Mall Saturday and then head home the same evening.