Dec 17 2009
Statistical Tricks 101 – How To Create Runaway Global Warming
“Hide the decline” or “The End of The World is Nigh!” – whatever you want to call it, what we see happening with the IPCC and man-made global warming is simply horrible mathematics. With 100’s of billions of dollars on the line it could also be considered a criminal deception. For those who don’t understand how easy this all is, let me show you.
Let’s look at the classic man-made global warming graph, with its false and overconfident error bars:
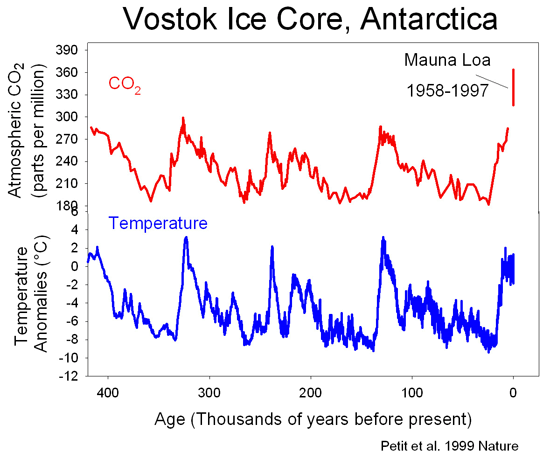
This is a theoretical historic record (not the ‘measured’ record) littered with unsubstantiated assumptions. It is a small segment of a vary large and well known natural cycle, as seen in this overly compressed ice core graph:
The reason this is overly compressed can be found here (where we uncompress the timeline and discover very important details the man-made warming alarmist would rather we cover up and hide). The first graph covers the last 120 years, the second the last 400,000.
What you need to understand is that when you put a linear trend line on these graphs, it is imperative to know where start and end and why picked that period of time. Because that makes all the difference between an Earth doomed to run away global warming, versus an Earth doomed  to run away global cooling, versus Earth doing its usual thing as it has for billions of years. This selection of the data ‘period’ is the most insidious lie you can find in the laundry list of AGW misinformation and cover up.
I put together a data series representing a physical climate process to demonstrate my point. The first graph models the classic AGW chart very closely, and therefore produces the infamous run away linear global warming, end of the Earth as we know it, scenario (purple line):
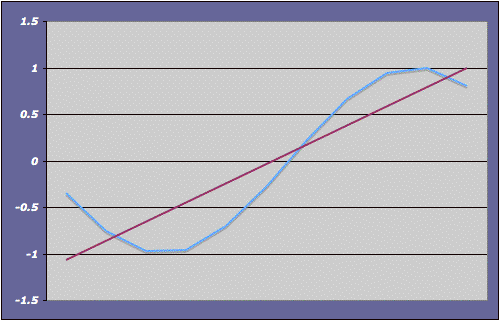
As we can see we have the cooling in the early part of the graph, then rampant warming near the end of the series, resulting in a high positive slope in the linear trend (purple line). It even shows recent cooling and why some claim there is still an underlying warming happening.
Now this next graph shows something a bit different. It more accurately reflects the last two decades with a peak temperature high in 1998 with a cooling trend since:
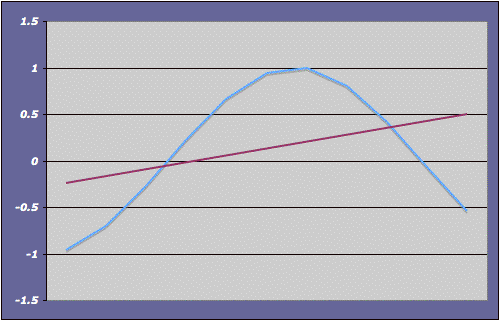
Everyone can see how the selection of period effects the trend line slope (and drama). Here the start was a bit cooler than the end, therefore the overall linear trend is still tilted upward towards rampant warming.
The next chart depicts what might happen if there are three decades of cooling, as has been predicted by some scientists:
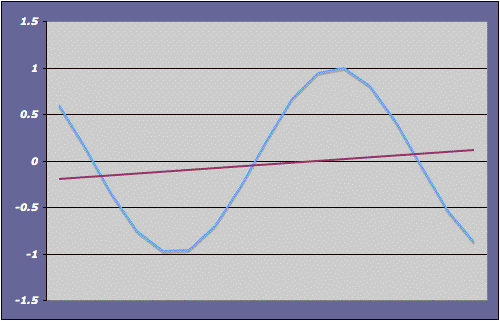
Here we see all the warming claimed in the last century erased as we settle back into a temperature range similar to that seen prior to 1960. If this is where we are heading the linear trend towards doom is much flatter, yet still indicating general warming.
So now you are asking which of these graphs are right? Well, they ALL ARE!
As Lord Mockton noted in his comments on Copenhagen, it all depends on the period you select to create the linear trend. It’s the big AGW con laid bare. It is how the AGW alarmists dupe the math challenged Pols (Al “Einstein” Gore) and liberal news media.
I have to confess that I have been playing a trick all along here. I have been zooming in on a subset of the full data ste, moving the ‘period’ window slight forward at each step. As I move the window forward the steep linear line in the first graph drops lower and lower. So now let me show you the full data set and the actual trend line:
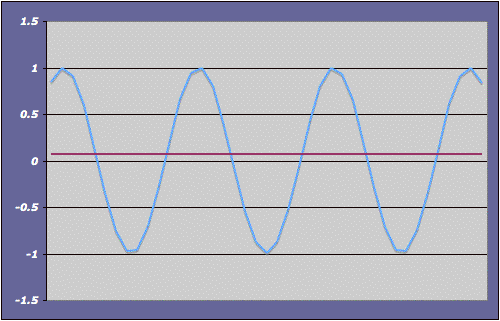
All these graphs are on the same data set. That is your classic sine wave you see folks. The trend line is dead flat since this is how sine waves act. Sine wave represent a lot of natural processes, and they are very similar to the long term temperature and CO2 trends we see in the second chart above where we see Temp and CO2 rates have been cycling up and down for almost half a million years.
What this means is the first two charts can be views of the same data, where one is simply an extremely misleading blow up of the other (time wise). What this also means is that to put a trend line  on the zoomed it portion of the larger data set is completely misleading to the historic nature of the phenomena being measured.
To create the myth of warming simply requires selecting the proper period of the cycle and making silly graphs.
Those of us who see the current warming of the Earth as nothing more than the natural cycle of climate we have seen on Earth for centuries (evidenced by the Medieval Warm Period), and clearly just the normal climate response we should see as we come out of a recent cool spell (the Little Ice Age) are not being deceptive or big oil dupes.
We are seeing the big picture. We ARE NOT exaggerating one small piece of the picture and declaring the end of the world is nigh to meet a political end and try and steal trillions of dollars of hard earned money.
There in lies the difference.



[…] This post was mentioned on Twitter by Cameron Gilchrist, AJ Strata. AJ Strata said: new: Statistical Tricks 101 – How To Create Runaway Global Warming http://strata-sphere.com/blog/index.php/archives/11919 […]
Once they get the data straightened around,( I am not holding my breath) then the problem with the IPCC models will become more real and disastrous to the AGW claims. It doesn’t get much simpler than this. http://www.drroyspencer.com/research-articles/satellite-and-climate-model-evidence/
If you’re going to use ice core data why not pick this one from NOAA. It shows a peak temp 8000 years ago and a minor, not uncommon blip up right now that is still low. http://www.foresight.org/nanodot/wp-content/uploads/2009/12/histo3.png
He did use that one a few days ago….
They say it will only cost the US about $100 billion …
[This is the full text of the address given by US Senator James Inhofe, R-OK, delivered to the delegates attending the UN Climate Change Conference in Copenhagen on Thursday, December 17.]
Copenhagen attendees, I want to turn back the clock to December 2003, when the United Nations convened the “9th Conference of the Parties” in Milan, Italy, to discuss implementation of the Kyoto Protocol. At the time, I was leading the Senate delegation to Milan as Chairman of the Senate Committee on Environment and Public Works [Mr. Inhofe is now Ranking Member of the committee].
Fast forward to December 2009: the UN is holding its 15th global warming conference-and the delegates are haggling over the same issues that were before them in 2003. I know this because I was there. Recently, with the Copenhagen talks underway, I reread the speech I delivered in Milan. I found that the issues at stake in 2003 are nearly the same as those in 2009. In short, nothing has changed and nothing has been done.
So let’s go back to 2003. In my speech, I told the conference that the Senate would not ratify Kyoto. Here’s what I said:
“The Senate, by a vote of 95 to 0, approved the Byrd-Hagel resolution, which warned the President against signing a treaty that would either economically harm the United States or exempt developing countries from participating.” I went on to say: “Both those conditions then, and still to this day, have not been satisfied. So, it’s worth noting that even if President Bush wanted to submit the treaty to the Senate, it couldn’t be ratified.” That was 2003.
Is that still true today? Of course it is. And yet here we go again: China, India, and other developing countries want nothing to do with absolute, binding emissions cuts. China and India have pledged to reduce the rate of growth, or intensity, of their emissions. But that’s not acceptable to the US Senate. Moreover, China is opposed to a mandatory verification regime to prove it is actually honoring its commitments.
Beyond that, developing countries are demanding billions of dollars from the US and other developed countries to deal with the impacts of climate change. President Obama has offered $1.3 billion in 2010. Developing countries think this isn’t enough; I think it’s too much.
In any case, with 10 percent unemployment, American taxpayers won’t be pleased that their tax dollars are going to help China fight global warming. They would probably ask, “We are going to give China $1 billion to fight global warming, and they own $800 billion of our debt? I don’t think so.”
So the Copenhagen talks are stalemated. It’s clear to all that developing countries don’t want burdensome regulations to stifle their economies. I don’t blame them. Well, that’s the way we feel right here in America. That’s why no global warming treaty that causes serious harm to the US economy, or that doesn’t include equal commitments from the likes of China and India, will ever be ratified by the US Senate.
In 2003, after mentioning Byrd-Hagel, I talked about the recent vote in the Senate on the McCain-Lieberman bill. Now remember, this was the first time cap-and-trade came to a vote on the Senate floor. What happened? Here’s what I said to UN delegates in Milan:
“All told, supporters mustered 44 votes, falling well short of a majority. But this doesn’t tell the whole story. In the U.S. Senate, a senator or group of senators can block legislation through what’s called a filibuster…Breaking a filibuster requires 60 votes. As is obvious, McCain-Lieberman supporters, even with a bill full of holes and exemptions-in other words, a pale shadow of its former self-didn’t even come close to crossing that threshold.” They needed 60, they got only 44.
Here we are six years later, and nothing has changed: cap-and-trade failed in 2003, it failed in 2005, and it failed in 2008. As we look ahead, an economy-wide cap-and-trade bill stands no chance of passing. I want to be sure the 191 countries represented here understand this: again, an economy-wide cap-and-trade bill stands no chance of passing.
One of the reasons cap-and-trade is doomed in the Senate has to do with the science. In Milan in 2003, I discussed the so-called “hockey stick” graph. Some may remember this graph: it showed a relatively straight line starting in 1000 AD and then a sharp curve, or blade, shooting upward in 1900.
To some, that proved the catastrophic global warming hypothesis. The problem was that, as I pointed out in Milan, the methodology used to create the hockey stick was suspect, to say the least. In any case, after its flaws were exposed, that once-influential work was thoroughly discredited.
Six years later, and the hockey stick is shattered beyond repair. We are talking about it today because of Climategate. Many here are familiar with it; it has dominated the news, and it’s a huge deal. Don’t take my word for it; just do an Internet search and here’s what you’ll find from:
– The Guardian (George Monbiot): “Pretending this is not a real crisis isn’t going to make it go away. Phil Jones has got to go.”
– The Atlantic Monthly (Clive Crook): “The stink of intellectual corruption is overpowering.”
– UK Telegraph (Christopher Booker): “This is the worst scientific scandal of our generation.”
– Financial Times (Michael Schrage): “Secrecy is at the rotten heart of this bad behavior.”
This was redeeming to me, because I gave a speech on these very issues four years ago.
But along came Climategate. Emails were leaked from the University of East Anglia’s Climatic Research Unit, which compiles one of three global temperature data sets-so it’s important, its work is used by the IPCC. These emails apparently show the world’s leading climate scientists manipulating data, violating information disclosure laws, and blocking publication of research contrary to their own. I could go on and on reading the emails, but it would take hours to finish. So here’s one example:
– “I’ve just completed Mike’s Nature trick of adding in the real temps to each series for the last 20 years (i.e. from 1980 onwards) and form 1961 for Keith’s to hide the decline.” [From Phil Jones]
Of course he means hide the decline in temperatures, which caused another scientist, Kevin Trenberth, to write: “The fact is we can’t account for the lack of warming, and it’s a travesty that we can’t.”
Again, these are IPCC scientists. Their work provides a principal basis for EPA’s endangerment finding, which EPA announced just last week. Now the credibility of the IPCC and its work has collapsed.
And here’s how all of this relates to Milan. In 2003, scientists told me the hockey stick was fatally flawed, and I believed they were right. Well, we were right: the hockey stick has been totally debunked. And now Michael Mann – author of the hockey stick – is at the center of the Climategate scandal and under investigation by his employer, Penn State University.
Now this is important for all of you in Copenhagen. Even without Climategate, cap-and-trade will still be soundly defeated.
But because of Climategate, Kyoto’s most ardent supporters are retreating on the science. Tony Blair, former Prime Minister of Great Britain, issued a rather confusing statement yesterday. Here’s his take: “It is said that the science around climate change is not as certain as its proponents allege. It doesn’t need to be.”
He then went on to say, “What is beyond debate, however, is that there is a huge amount of scientific support for the view that the climate is changing and as a result of human activity.” But then in another nod to the view that the science is uncertain, Blair said the world should act to address global warming “purely as a matter of precaution.” So a cost of $300 to $400 billion a year for the US-this is “purely as a matter of precaution”?
The problem with Blair’s precautionary principle is the massive economic costs involved. This was a topic I raised in my speech in 2003. I noted the economic analysis of Kyoto by Wharton Economic Forecasting Associates. Here’s what Wharton found:
– “According to WEFA economists, Kyoto would cost 2.4 million US jobs and reduce GDP by 3.2%, or about $300 billion annually, an amount greater than the total expenditure on primary and secondary education.
– “Because of Kyoto, American consumers would face higher food, medical, and housing costs-for food, an increase of 11%, medicine, an increase of 14%, and housing, an increase of 7%. At the same time an average household of four would see its real income drop by $2,700 in 2010, and each year thereafter.
– Under Kyoto, energy and electricity prices would nearly double, and gasoline prices would go up an additional 65 cents per gallon.”
Today the cost of cap-and-trade bills before the House and Senate bear striking resemblance to those of Kyoto. Take the Waxman-Markey bill, for example.
A government study by the Energy Information Administration concluded that the Waxman-Markey bill destroys up to 2.3 million jobs in 2030 and destroys up to 800,000 manufacturing jobs in 2030-and, I should note, those figures include new green jobs, so they are net job losses.
This past September, under pressure from a Freedom of Information Act request, the Obama Administration released a per-household cost estimate of the President’s cap-and-trade program. The cost per family was over $1,700 per year. Again, that would be the largest tax increase in history.
Finally, a top issue in 2003 was the extent to which developing countries – that is China, India, and others – would address global warming. As I noted earlier, the Byrd-Hagel resolution, which the Senate approved 95 to 0, stated that the Senate would not ratify a global warming treaty unless it “mandates new specific scheduled commitments to limit or reduce greenhouse gas emissions for Developing Country Parties within the same compliance period.”
At the time, China and India were adamantly opposed to accepting binding emissions reductions. So what are they saying now?
Well, it’s déjà vu all over again. Consider this from India’s Environment Minister, delivered on June 30: “India will not accept any emission-reduction target – period. This is a non-negotiable stand.”
China said very much the same thing recently. This is from the spokesman for China’s Foreign Ministry: “It is natural for China to have some increase in emissions, so it is not possible for China to accept a binding or compulsory target.”
Now some believe China’s commitment announced a few weeks ago to reduce its greenhouse gas intensity by 40 to 45 percent and India’s to reduce theirs by 20 to 25 percent was a significant step forward. For example, Jonathan Lash, president of the World Resources Institute, said, “[China’s and India’s intensity target] shows that international engagement on climate change can produce real results.”
Yet the reality is quite different – that’s because China’s, and India’s, emissions would continue to increase on an absolute basis. Just consider China: under their offer, they could increase emissions by 250 percent by 2020.
Todd Stern, President Obama’s top climate negotiator, said on September 2 that China’s intensity reduction is “not an absolute reduction below where they are right now, because they’re not quite at that point to be able to do that. And in that respect, developed and developing countries are different.”
Even if China proposed mandatory reductions, President Obama should not make any pledges or commitments when he goes to Copenhagen. That’s what I believe – and apparently so do some Democrats in the Senate. Senator Webb of Virginia, for example, sent a letter to the President on November 30, in which he wrote:
“Although details have not been made available, recent statements by Special Envoy on Climate Change Todd Stern indicate that negotiators may be intending to commit the United States to a nationwide emission reduction program. As you well know from your time in the Senate, only specific legislation agreed upon in the Congress, or a treaty ratified by the Senate, could actually create such a commitment on behalf of our country.”
I agree with Sen. Webb that the Senate must have a role in ratifying a global warming treaty-or any treaty for that matter. Nevertheless, I don’t think we here in the Senate have much to worry about. There will be no agreement in Copenhagen. It has failed. The intractable issues on the table in Milan in 2003 haven’t been resolved, and they won’t be this week either. So it’s clear that nothing has changed. The Copenhagen party is about over, the caviar is about gone.
And the American people have caught on. Just look at the polls.
According to Rasmussen, after the Climategate scandal broke, 59 percent of Americans say that some scientists have falsified research data to support their own theories and beliefs about global warming. Just 26 percent take the opposite view. Or take the Pew Research Center poll this past January. When asked to prioritize a list of 20 public policy issues, respondents put climate change dead last.
And the Senate has responded. At most there might be 25 votes in the Senate for a cap-and-trade bill, and they need 60.
My stated reason for attending Copenhagen was to make certain the 191 countries attending COP-15 would not be deceived into thinking the US would pass cap-and-trade legislation. That won’t happen. And for the sake of the American people, and the economic well-being of America, that’s a good thing.
SBD
Phrase of the day:
“common but differentiated responsibility”
Definition: a shared responsibility that must be borne by one party more than another based on a non sequitur.
Expect to see this used a lot in the future
Welcome to Belgium. Copenhagen is the new Waterloo.